PicoScope 7 Automotive
Available for Windows, Mac, and Linux, the next evolution of our diagnostic scope software is now available.
Automotive guided tests
Library of examples on how to perform tests when using PicoScope.

Training
Our collection of training videos, articles, guides and information on training courses.

Waveform library
The Waveform Library is a global database of waveforms uploaded by PicoScope users.

Case studies
Real-life case studies show how the professionals use PicoScope to diagnose vehicle faults.

A to Z of PicoScope
Detailed description of various PicoScope software and hardware features.

Videos
Training resources and demonstrations on PicoScope and the Automotive Diagnostics Kit.

Newsletter
Archive of our monthly Automotive Newsletters.

Documentation
Download manuals, brochures, posters, and training materials.

Reviews and awards
Accolades for the preferred diagnostic tool for service centers and vehicle manufacturers.

Actions can be programmed in PicoScope 7 and will execute when certain events occur. The events that can trigger an action are:
The actions that PicoScope can execute are:
Actions, coupled with mask limit testing, help to quickly validate signal quality in electronic system designs. Testing can be done over extended periods of time while parameters such as supply voltage or temperature are changed to validate that the design operates reliably over the full range of specified operating conditions.
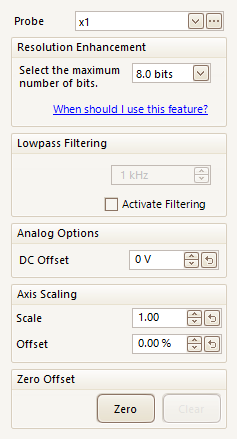
Also called DC offset. This valuable feature can give you back the vertical resolution that would otherwise be lost when measuring small signals.

Auto arrange moves and scales your waveforms, Reference waveforms and Math channels within a View so they do not overlap.
Auto setup looks at the incoming measurements on your PicoScope’s channels and sets the range and timebase to display suitable on-screen waveforms.
A Bandwidth limit reduces unwanted waveform noise.
You can apply a Bandwidth limit to any channel of a PicoScope 4x25 or 4x25A Automotive oscilloscope. The limit is fixed at 20 kHz. This means any parts of your measured signal that have a frequency above the limit will be reduced in amplitude. And the higher their frequency above the bandwidth limit, the greater the reduction.
Bandwidth limiting is also referred to as hardware or analog filtering.

CAN bus (Controller Area Network) is a serial data standard originally developed in the 1980s by Robert Bosch GmbH for use in automotive applications. Today it is also widely used in industrial process control and aerospace applications.
It allows microcontrollers and electronic devices to communicate with each other without using a host computer and provides fast and reliable data transfer in electrically noisy environments at low cost and with minimal wiring.
CAN employs differential signaling to provide a high level of immunity to electrical noise.
PicoScope software allows many frames of CAN and CAN FD (Flexible Data-rate) data to be fully decoded both in a table format and in a colour-keyed trace, time aligned with the data signal.
More information on CAN & CAN FD - serial protocol decoding >>
You can use Channel labels to describe the measurements on your scope channels. You can select from a list of over 250 common automotive measurements or create your own custom labels.

Most of the settings related to capturing, conditioning and displaying a measurement on one of your oscilloscope’s input channels are within the channels’ Channel options panels.
You can use Channel options to:
Please refer to the relevant sections of the A-Z of PicoScope for additional information about the features within the Channel options panel.
Connect device lists the devices (PicoScope oscilloscopes) connected to your PC so you can choose one to capture waveforms with.
In addition, Connect device indicates whether the connected devices are compatible with the PicoScope Automotive software: all PicoScope Automotive oscilloscopes are compatible, however, other PicoScope oscilloscopes are not.
If no PicoScope Automotive oscilloscopes are available, you can select a demo device and explore the software features and capabilities using simulated waveforms.
ConnectDetect® - available on PicoScope 4x25 and 4x25A Automotive oscilloscopes - indicates whether you have good connections between your test leads and circuits.

Sometimes you have small waveform variations but they are found at a relatively large and constant offset from zero. We can label the small varying part of the waveform as an Alternating Current (AC) and the relatively steady-state offset as a Direct Current (DC).
By changing your PicoScope Automotive oscilloscope channel’s Coupling mode you can change how you view these AC and DC parts of your waveforms.
With AC coupling, PicoScope rejects very low waveform frequencies, below about 1 Hz. This removes the offset so you can use the channel’s full resolution to accurately measure the AC waveform characteristics. The consequence of AC coupling is that the waveform is centered around zero and you cannot measure the waveform level with respect to ground.
DC coupling does not remove the offset and the waveform retains its level relative to measurement ground. I.e. both the AC and DC parts of the waveform are preserved.
By changing and scaling your measurements to have different values, units or ranges, Custom probes convert your channel inputs to a better on-screen view of the measurement quantity you are interested in.
For example, you can create, load or save Custom probes to:
Many automotive oscilloscopes still use an analog trigger system based on comparators. This causes time and amplitude errors that cannot always be calibrated out, and that often limits the trigger sensitivity at high bandwidths.
Automotive PicoScopes are fast enough to display FlexRay signals accurately. FlexRay is a vehicle data bus standard used in active suspension systems. Its high speed means that the signal quality is critical, and only a fast scope can reveal problems like reflections and ringing.
We recommend using the 100 MHz Oscilloscope Probe for connecting to FlexRay signals, to make sure you have minimal distortion. This probe is included in PicoScope Advanced Diagnostic Kits.

Frequency counting (available with PicoScope Automotive 4000 series oscilloscopes) calculates and displays the frequency (in units of cycles per second, Hz) of one of your waveforms as it changes in real-time.
Full screen expands the graph area of your chosen View so it fills the whole screen.
Guided tests provide you with information and settings that support you through your diagnostic test process. For example, they:
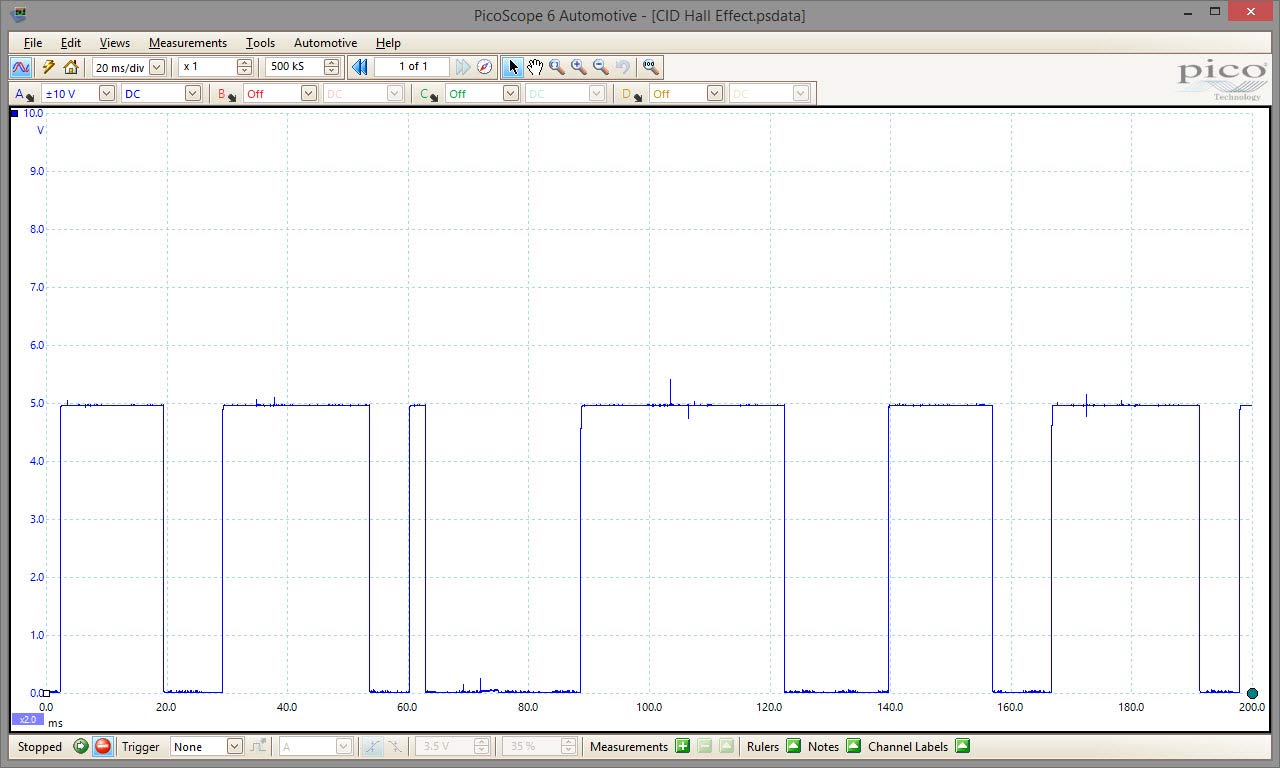
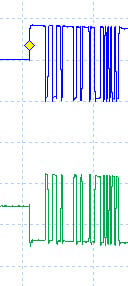
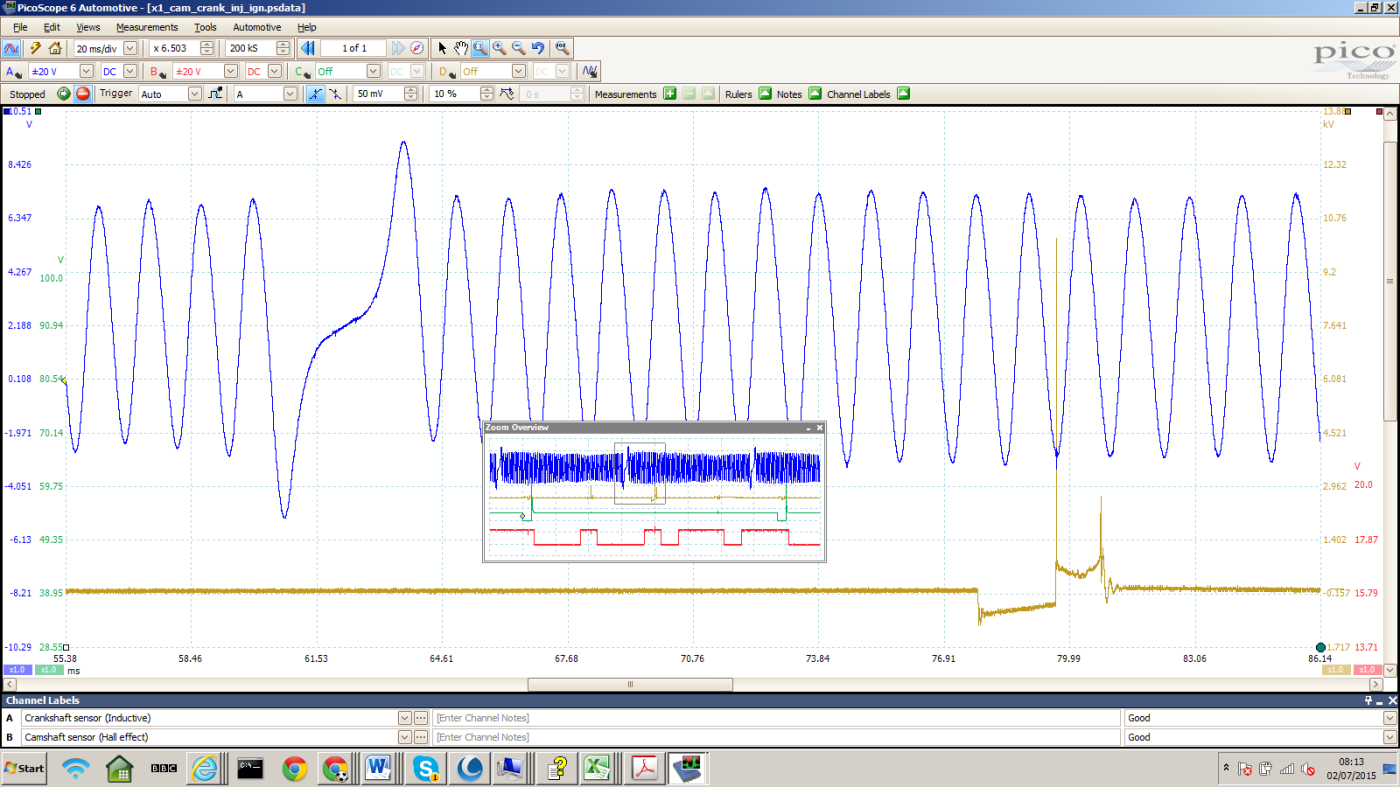
The Hall effect sensor is commonly used in camshaft and crankshaft position sensors, but can also be found in other applications, such as ABS sensors.
PicoScope displays the Hall voltage pulses as a square wave, thereby reproducing the signals received by the camshaft and crankshaft position sensors.
As with PicoScope 7 Automotive’s other Serial decoding tools, the CAN J1939 serial decoder converts CAN bus voltages to a human-readable form (typically hexadecimal but binary, decimal or ASCII formats are possible). However, the decoder is specifically built for decoding J1939 CAN protocol messages.
Don’t know your BCM from your ECM, or your CAN from your LIN? You’re not alone. Click on this link to see the list of some of the popular abbreviations that are used in automotive diagnostics: https://www.picoauto.com/library/jargon-buster
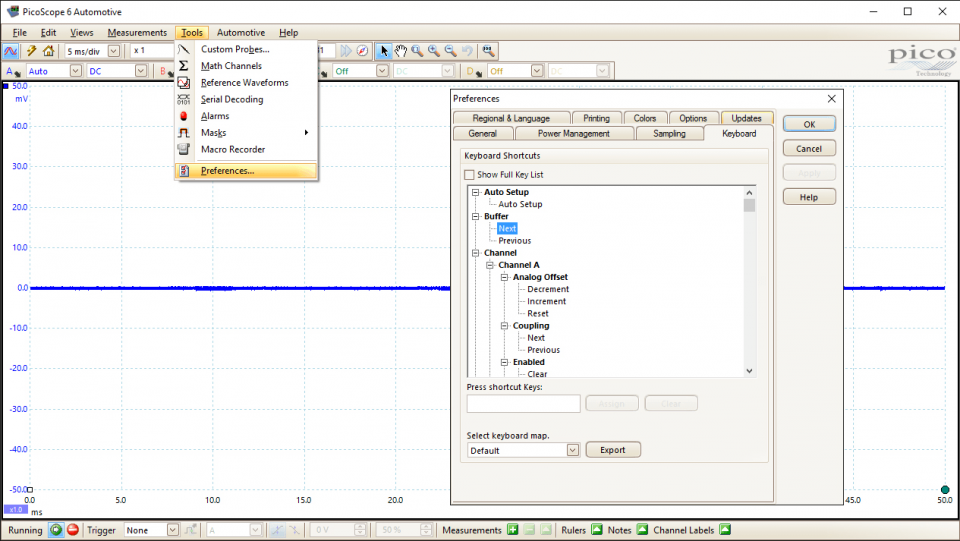
PicoScope software provides a set of default and advanced keyboard shortcuts (called a map) that provide access to common functions. You can create your own maps, and can also import/export maps for loading onto another PC in case you use your PicoScope with more than one computer.
LIN (Local Interconnect Network) is a serial protocol used in automotive electronics to allow microcontrollers to communicate with low-speed peripherals. The standard was defined by the LIN Consortium, a group of five vehicle manufacturers. It uses a single wire pair with a master-slave topology, offering lower cost, reliability and data rates than CAN – hence its use in non-critical, low-speed applications.
Low pass filters can be used to reduce measurement noise and clean up your waveforms.
Each of your PicoScope channels can have a low pass filter operating at a different cutoff frequency so the waveform present on each can be filtered differently, or not at all.
The low pass filters are applied to the data in each complete waveform buffer (the part of the oscilloscope's memory that stores a chunk of data) after the measurements have been captured; you will not see the filtering effect until after the buffer is full.
You can use Math channels to calculate new waveforms from your captured waveforms and gain more insight into your test results.
You are free to create as many Math channels as you need and each one can be the result of one or more operations performed on one or more of your original waveforms.
Math channels waveforms are created after each waveform buffer (the part of the oscilloscope’s memory that stores a chunk of data) has been filled; you will not see them until after the buffer is full.
Example Math channels operations are:
You can use the Measurements feature to calculate the values of many commonly observed waveform characteristics. You can apply multiple Measurements to each of your waveforms and the resulting values are calculated and displayed in the Measurements view after the necessary data has been captured.
Example Measurements are:

The best way to diagnose an intermittent fault is often to set up the scope to measure from several components and wait for the fault to occur. For an intermittent misfire, you might want to capture several minutes of cam, crank, ignition and injector waveforms. These types of tests require an oscilloscope with a "deep" memory buffer so that you can capture for long periods of time and then zoom in without any gaps or loss of detail.
With PicoScope, you can collect 250 MILLION samples, more than any other automotive oscilloscope. Our advanced "always-on" memory technology uses hardware acceleration to make sure that the processing of large amounts of data does not slow the oscilloscope down even when you are using a slower or older PC.
You can use Notes to record any relevant test details, such as the test or environmental conditions, descriptions of the test set up or configuration, or notes about specific waveform features.
Any notes added to the Notes area are stored with your waveforms when you save them.
Persistence is a graphing mode that overlays incoming waveforms on top of each other so that you can see how or whether they with time.

With a simple connection to the battery, the PicoDiagnostics software quickly performs the following tests:
The Battery test within our PicoDiagnostics software (bundled with PicoScope 7 Automotive) calculates measures of a vehicle’s battery, alternator, starter motor and circuit health, including:
The Compression test within our PicoDiagnostics software (bundled with PicoScope 7 Automotive) reveals engine mechanical issues by calculating relative compression values for each of your engine’s cylinders. The compression values are displayed as a bar graph for easy comparison.
You can add a WPS500X pressure transducer to give you absolute compressions, in units of bar or PSI, across all cylinders.
The Cylinder balance test within our PicoDiagnostics software (bundled with PicoScope 7 Automotive) reveals misfires or uneven power contributions resulting from combustion anomalies within your engine’s cylinders.
More information on PicoDiagnostics - Cylinder balance test >>
Our PicoDiagnostics NVH software (bundled with PicoScope 7 Automotive) works in combination with our NVH Diagnostics Kit to provide measurement and analysis tools for noise, vibration and harshness within vehicles and machinery.
PicoDiagnostics NVH captures and displays noise and vibration with respect to its offending frequencies and amplitudes so that you can identify its likely source and the cause of your customer’s complaints.
With a suitable set-up or vehicle interface, PicoDiagnostics NVH can also link offending the noise and vibrations to rotating machinery sources (such as motors and their drivetrains) by calculating vibration orders from its measured or calculated rotational speeds.
More information on PicoDiagnostics - Noise, Vibration and Harshness (NVH) >>
Our PicoDiagnostics Propshaft balancing software (bundled with PicoScope 7 Automotive) works in combination with our NVH Diagnostics Kit to take you step-by-step through the propshaft balancing process and, by measuring the propshaft speed and vibrations, reports back the adjustments you need to make to minimise an unbalance.
You can choose from two balancing methods - using either trial weights applied to the differential pinion flange or trial hose clamp positioning about the circumference of the propshaft - depending on the application.
More information on PicoDiagnostics - Propshaft balancing >>

PicoScope 6 Automotive is the previous major version of our software for PicoScope Automotive oscilloscopes.
We now recommend using PicoScope 7 Automotive as, unlike PicoScope 6 Automotive, it will continue to receive regular new features, updates and bug fixes.

PicoScope 7 Automotive is the latest major version of our software for PicoScope Automotive oscilloscopes.
The software receives regular updates - accessible within the software - providing new and updated features and bug fixes.

Preferences contains settings you can use to customise the behaviours of PicoScope 7 Automotive. These include:
Print prints the currently displayed waveform along with any notes you added using Notes.
Probe mismatch recognises and warns you when you start a capture and the detected probes do not match those selected in the software settings. Capturing starts when all the correct probes are connected.
When Probe mismatch does not detect a PicoBNC+® probe, the feature suggests a set of alternative probes, giving you the opportunity to correct the mismatch. You can also choose to continue without making corrections.
Probe mismatch is available for all PicoBNC+® compatible PicoScope Automotive oscilloscopes.

You use Probes in PicoScope 7 Automotive to set the probe (test lead, current clamp, ignition pickup and pressure transducer etc.) connected to your PicoScope’s input channel. You can select a probe from the pre-defined list or use Custom probes to create, add or delete alternatives.
The selected probe indicates to the software how to scale and display your waveforms and defines the measurement ranges you have available in the Vertical panel.
You can create duplicates of any recently captured or loaded waveform, in any scope or spectrum view, using Reference waveforms. The duplicated waveforms remain fixed on-screen as a reference against which you can compare your captured waveforms.
Resolution enhance increases the effective vertical resolution of your waveforms at the expense of high-frequency detail. You can apply resolution enhancement individually to each of your captured waveforms.
You can use Rulers to take measurements between different points on your waveforms, including those created by your Channels, Math channels and Reference waveforms.
There are three different types of rulers: Horizontal rulers, Vertical rulers - together known as Graph rulers - and Phase rulers. Every axis within each of your PicoScope Views has a pair of either Horizontal rulers or Vertical rulers associated with it.
PicoScope can draw Rotation Rulers on a waveform to indicate rotation angles of the crankshaft or camshaft. This feature is particularly useful for analyzing compression waveforms on a four-stroke engine.
The time rulers measure time on a scope view. In the scope view, the small white squares on the time axis are the time ruler handles. When you drag these to the right from the bottom left corner, vertical dashed lines called time rulers appear.
At the same time the Ruler legend will appear. This shows the position of any time rulers that are in use. If there are two time rulers, it will also display the difference between them. Clicking the Close button on the ruler legend deletes all the rulers.
PicoScope 7 Automotive's Run control is used to start the scope so that when it is Running it is in a state ready to capture waveforms (triggers permitting) and when it is Stopped it isn't.

Samples are best explained when we think back to the days of creating a line graph on graph paper. You would take your data, and count along the x and y axis in order to mark a point, before moving on and making another, and another and another. You would then draw lines between these points to make your line graph.
These points are called samples (the lines you drew are how the oscilloscope draws the waveform between these samples).
Sampling helps you to set the total number of samples (single measurement values at regularly spaced intervals) that make up each of your waveforms and the rate at which they are taken.

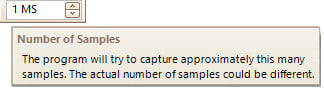
Leading on from our Samples information, sampling rate is simply how many samples will be taken per second. This setting is important when you think about the amount of data you wish to collect, and over what time period.
For a slowly changing signal requiring a longer recording time, use a low sampling rate. For a fast-changing signal over a short time period, use a high sampling rate.
The sampling rate is controlled by the Number of Samples setting in the PicoScope software. Here you tell the software how many samples you wish to collect across your capture. The actual sampling rate (X S/s) can be seen in the Properties panel (Views > View Properties).
When choosing a sampling rate, you must consider the timebase you are capturing over and the memory of your scope (our latest automotive scopes all come with a 250 million sample memory).
Save creates a PicoScope data (psdata) file containing all your capture and view settings, data and maths channels, ruler positions, measurements, notes, channel labels and vehicle details so you can store them for future reference and use.
You can use Serial decoding to convert serial communication network voltages to a human-readable data format. You can apply it to CAN, CAN-FD, FlexRay, LIN and SENT (Fast and Slow) networks.
The data returned by Serial decoding describes all parts of the message structure, including its data payload and other properties, such as IDs, lengths or checksums etc.
The decoded data is returned in a tabular format and directly under the voltage waveforms. The two representations are linked so that clicking on one will highlight the other in its respective view. Data can be viewed as hexadecimal, decimal, binary and ASCII formats and one format can be used for the decode table and another for the graph.
The table view provides tools to search, sort, filter and export the decoded data.
Finally, you can select a data-to-text (link) file which gives the decoder the information it needs to turn decoded data into text form. Link files can be manually created from exported serial decoding data or from information within other sources such as Society of Automobile Engineers (SAE) documents or CAN database (DBC) files.
Spectrum view displays the amplitudes of all the underlying frequencies that occur within your waveforms. The feature processes your waveforms using a Fast Fourier Transform (FFT) and displays their amplitudes on the vertical axis against frequency on the horizontal axis. The FFT is repeatedly applied to successive parts of your waveforms so that you can see how the amplitudes against frequency change with time.
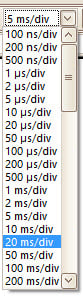
You can use the Timebase control to set your PicoScope’s timebase and gain access to the related set of sampling settings.
Your oscilloscope’s timebase sets the total duration of each of your displayed waveforms. It is expressed as time per division: As there are always ten time divisions across PicoScope’s graph views, the timebase is equal to the total waveform duration divided by ten. So, if a displayed waveform has a total duration of two seconds, the equivalent timebase setting is 200 ms per division.
You can think of your scope’s timebase as representing the speed with which your waveform fills the screen: a low timebase will cause your waveforms to fill your screen more quickly than a high timebase. For this reason, some people refer to timebases as being fast or slow.

PicoScope is easy to use, but not everyone uses it all day and every day. To help both new users, and as a reminder for experienced technicians, Pico offers a wide range of training materials and training partners.
Training manuals, videos and other resources are available in our library (just select the library on the top level tabs).
In the training section you will also see details about Pico trainers in various markets. Any of our distributors can provide (or arrange) training, so please also contact them directly.
Visit our documents section, or view the case studies for even more heplful information and tips.
If you have any problems, please email support@picotech.com

Trigger monitors one of your incoming waveforms and checks its behaviour against the conditions set within the trigger options. Once the monitored waveform meets those conditions a capture is triggered and your waveforms are stored and displayed. One typical set of trigger conditions, known as an edge trigger, is that the waveform amplitude must cross through a certain threshold value as it is heading in a particular direction (e.g. either rising or falling).
PicoScope Automotive Oscilloscopes use deep memory and hardware acceleration to achieve over 100,000 wfms/s to better capture signal behavior and dramatically increase the ability of the oscilloscope to quickly capture intermittent problems such as jitter, runt pulses and glitches – problems that you may not even know exist when using an inferior product.
You can save your preferred set of PicoScope 7 Automotive settings using the User settings feature. You can return the software to your user settings at any time using Reset configuration and, optionally, every time it starts up.
All the details you need to identify a vehicle can be entered into Vehicle details. The details can then be stored when you save your waveforms to a PicoScope data (psdata) file or upload them to the Waveform Library.
The Vertical panel provides all the options related to the treatment of the incoming waveform before it is digitised by your PicoScope oscilloscope’s analog-to-digital converter.

Vibration is any oscillation (regular movement) that is felt or seen by the vehicle occupants. Vibrations have low frequencies, below 200 Hz.
The PicoDiagnostics NVH System analyzes and diagnoses problems with Noise, Vibration & Harshness (NVH) that can be very difficult to isolate without specific tools.
Vibrations can be subjective, but the Pico NVH system provides objective results and can provide you with customer reports for 'before' and 'after' any fixes.
Views provides different ways to view, arrange and group your waveforms and analysis tools within PicoScope 7 Automotive.
You can create Scope and Frequency views to see your waveforms plotted against time or frequency. Each one has its own sets of Channels and Rulers, as well as a Zoom tool, and you can add Math channels and Reference waveforms to any available Scope view.
All Views, including the dedicated Channel labels, Measurements, Notes and Serial decoding views, can be moved and docked within any other view (i.e. at the top, bottom, left or right sides or as an additional tab).
Finally, Views has two layout automation tools: View per channel automatically creates a new view for each channel and Auto arrange automatically arranges the channels within a single view.
PicoScope Automotive includes a great feature that allows the Pico community to benefit from each other’s experiences. Under the File menu on the toolbar you will see Waveform Library Browser, this feature enables you to search and make use of a global database of waveforms uploaded by the worldwide PicoScope user community, for you to use as a reference for your own tests.
The Waveform Manager helps you quickly import and edit your local waveforms before uploading them to our free Waveform Library cloud storage. Once there, your waveforms are backed-up and readily available for you to access from other locations or PCs.

When you have captured one or more waveforms, you can use the Waveform navigator to browse through them and select the waveform you want to examine in more detail.
Zero channel offsets digitally removes the small offsets that are present within a measurement channel when the channel signal and ground inputs are shorted. The procedure ensures that your waveform is properly referenced to zero - that is, your waveform will read zero when the measurement at the part under test is zero.
Zoom lets you examine your waveforms in greater detail. Each of your PicoScope views has its own zoom control so you can examine the waveforms in each view independently of the waveforms in other views.


