PicoScope 7 Automotive
Available for Windows, Mac, and Linux, the next evolution of our diagnostic scope software is now available.
Automotive guided tests
Library of examples on how to perform tests when using PicoScope.

Training
Our collection of training videos, articles, guides and information on training courses.

Waveform library
The Waveform Library is a global database of waveforms uploaded by PicoScope users.

Case studies
Real-life case studies show how the professionals use PicoScope to diagnose vehicle faults.

A to Z of PicoScope
Detailed description of various PicoScope software and hardware features.

Videos
Training resources and demonstrations on PicoScope and the Automotive Diagnostics Kit.

Newsletter
Archive of our monthly Automotive Newsletters.

Documentation
Download manuals, brochures, posters, and training materials.

Reviews and awards
Accolades for the preferred diagnostic tool for service centers and vehicle manufacturers.

Following on from Scope School Part 1, you will have successfully captured that all-important waveform of interest, but where to now? In Scope School Part 2, we will discuss the analysis features of PicoScope 7 Automotive software that will enable you to determine if a fault exists with the device/signal under test.
While your captured waveform may appear normal, analysis is the key to a successful diagnosis, and here you will need to Measure and Zoom specific areas of interest in the waveform. In the example below, we analyse a 12 V port injector using simple but effective measurement rulers to reveal the hidden details that lie within.

At your disposal, you have numerous Signal rulers (two per channel) that will make you able to measure the points of interest in the waveform displayed in the graph view. Click on the signal rule handle adjacent to the top of your signal scale and drag to the point of interest within your waveform. Repeat this process by using a second signal ruler to determine the values at an additional location within the waveform and the Delta value (difference) between these rulers.
The numerical value of the signal ruler's position is displayed in the ruler handle or the Ruler legend located at the top of the graph view. The image below highlights the minimum, maximum and delta values of a 12 V port injector waveform, using the signal rulers for Channel A.

In addition to the signal rulers, we have two Time Rulers that provide accurate time measurements between any two points in the graph view. Click on the white time ruler handle located at the far left of the X-axis (Time) along the bottom of the graph view. Drag each time ruler to the point of interest in the waveform and refer to the Ruler Legend or ruler handle to determine their numerical time and delta values. Note: The Ruler Legend will also display the numerical Frequency and the RPM values based on the 'delta' between the time rulers.
This image indicates the start, end, and pulse width time of our 12 V port injector.
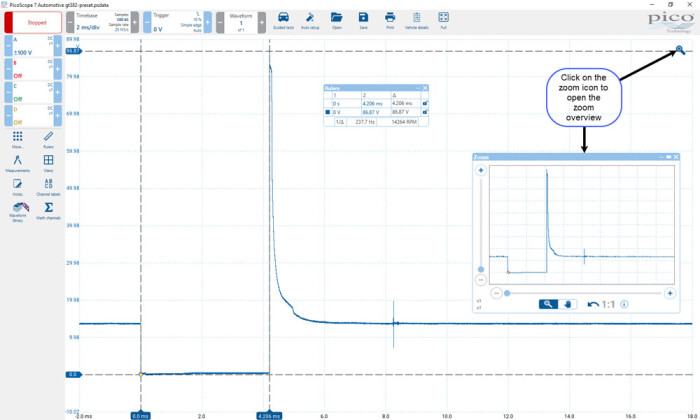
One of the most powerful and frequently used analysis tools is Zoom and PicoScope 7 Automotive has numerous options, such as pinch/mouse-wheel zoom (within graph view), horizonal/vertical slider zoom (within the zoom overview), and the Marque zoom. To access all zoom functions, in particular Marque Zoom, click on the magnifying glass (zoom icon) located in the top right-hand corner of the graph view. The zoom overview will open and your mouse pointer will change to a cross.
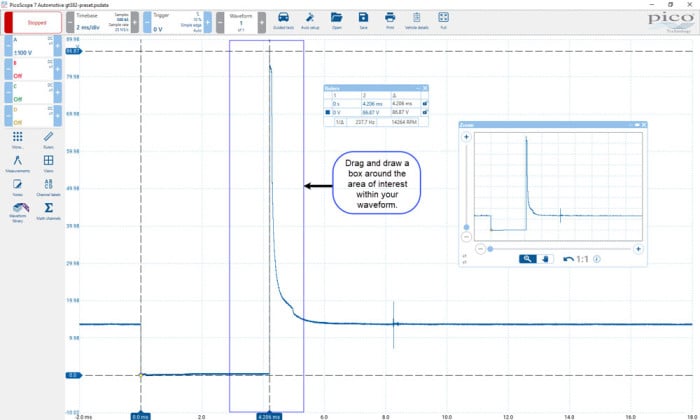
Hold down the left mouse button while you drag and draw a box around the area of interest in your waveform.
When you release the mouse button, the zoom function will enlarge the waveform to show only the framed area of interest in the graph view, while displaying the entire waveform in the zoom overview window for reference.
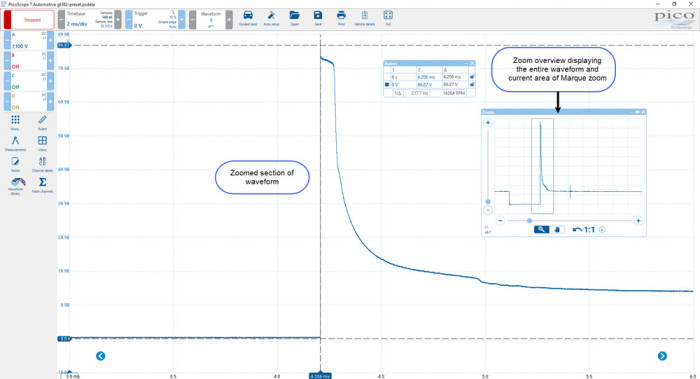
Remember, when zoomed in, that you can also use the Signal and Time rulers above to further evaluate the area of interest in your waveform.

The ability to customise the PicoScope 7 Automotive software further enhances user-friendliness during the initial capture and further analysis of waveforms. In Scope School - Part 1, we discussed the Auto setup button for automatic configuration of the scope settings and touched upon the Reset configuration button.
The reset configuration button will restore PicoScope to your user default settings (chosen start-up settings when PicoScope is launched) should you wish to revert to a known starting point.
The benefits of known start-up settings will decrease set up times and scope familiarity for all users carrying out typical or frequently repeated measurements, while also providing a fast-track option to revert the scope to your chosen default settings after a previous complex setup.
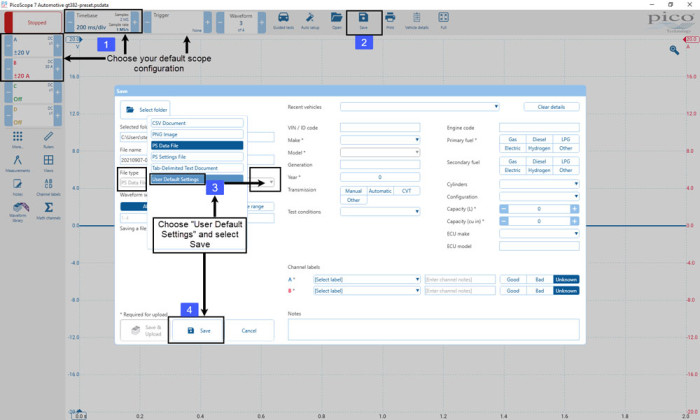
To customise your user default settings, configure PicoScope as desired; this includes active channels, channel input ranges, probes, time-base, sampling and trigger settings. In the example below, we have opted for an x1 probe on Channel A at +- 20 V and a 30 A current clamp on Channel B at +- 20 A. Our timebase is set to 200 ms/div at 1 MS/s without a trigger. (Channels C and D are set to off.)
Click on Save above the graph view, select User Default settings as your file type and click on Save in the save dialogue box. The PicoScope 7 Automotive software will now utilise the currently configured scope settings as the user default settings.
To revert to your user default settings while the scope is in use, click on the More button located in the left-hand tool panel and select Reset Configuration. To permanently relocate the Reset Configuration button to the left-hand tool panel, click on the star symbol adjacent to the Reset Configuration button. This feature will now be favourited for selection directly in the tool panel so you will not have to open the More menu.

Saving and sharing waveforms could not be simpler in the PicoScope 7 Automotive software, thanks to the combined Save and Upload feature. While on the surface, Save may seem a fundamental feature, the opportunities that arise post-save are invaluable. With you captures saved, you have:
To save your captured waveform, click on Save above the graph view and populate the fields within the save dialogue window. Below, we have completed the essential fields (marked with an asterisk - *) which are saved with the waveform and serve as the perfect reference during post-capture analysis.
To save the above waveform to your local machine only, select Save within the save dialog box. To save to your local machine and share your waveform with other users around the world, click on Save & Upload.
Please note: To share your waveform with other users via the Reference Waveform Library (RW), you will need your Automotive PicoScope connected to the PC, an active internet connection and a Username and Password for the Pico Auto forum. Further information on the Pico RWL can be found here.
Referring to Scope School Part 1, and Part 2 above, you now have the knowledge to capture a variety of waveforms with or without the use of the Automotive Guided Tests along with the tools to analyse and save waveforms for future reference.
Keep an eye out for Part 3, where we will discuss a select number of advanced features that include reference waveforms, scaling, coupling, sample control, buffers, and rotation rulers/partitions.


