PicoScope 7 Automotive
Available for Windows, Mac, and Linux, the next evolution of our diagnostic scope software is now available.
Automotive guided tests
Library of examples on how to perform tests when using PicoScope.

Training
Our collection of training videos, articles, guides and information on training courses.

Waveform library
The Waveform Library is a global database of waveforms uploaded by PicoScope users.

Case studies
Real-life case studies show how the professionals use PicoScope to diagnose vehicle faults.

A to Z of PicoScope
Detailed description of various PicoScope software and hardware features.

Videos
Training resources and demonstrations on PicoScope and the Automotive Diagnostics Kit.

Newsletter
Archive of our monthly Automotive Newsletters.

Documentation
Download manuals, brochures, posters, and training materials.

Reviews and awards
Accolades for the preferred diagnostic tool for service centers and vehicle manufacturers.

| Vehicle details: | Renault Scenic |
| Year: | 2010 |
| Symptom: | |
| Author: | Jarred Toms, Master Tech from Bristol |
Customer complaint:
Once a week the vehicle’s injection warning light illuminated and the vehicle entered limp home mode. Switching the engine on and off cleared the warning light and the vehicle seemed fine for another week. There were no running or performance issues before the warning light illuminated.
Background information:
The vehicle in question was fitted with an electronic throttle body that incorporates a 2-pin 12-volt DC motor. This is supplied with a live and earth on either track, depending on the throttle body butterfly being powered open or closed. The throttle body also has two potentiometer tracks that measure the position of the butterfly. Each track works within a 5-volt range. The two signals are opposing each other and at any given point the two tracks should add up to approximately 5 volts. The purpose of the two tracks is that a plausibility check can be carried out between the signals. This means that faults can be detected and a more accurate reading can be achieved.
You can find more information on throttle body operation and principles on Pico Technology’s website:
Diagnosis:
An initial fault code check was carried out, which revealed the following two stored fault codes:
The freeze frame data for both fault codes showed that the fault occurred when the throttle body butterfly was at 19% open.
A road test was carried out with the scan tool attached, monitoring tracks 1 and 2 of the throttle body position, especially at 19%. There were no driveability issues and the scan tool did not reveal any issues either.
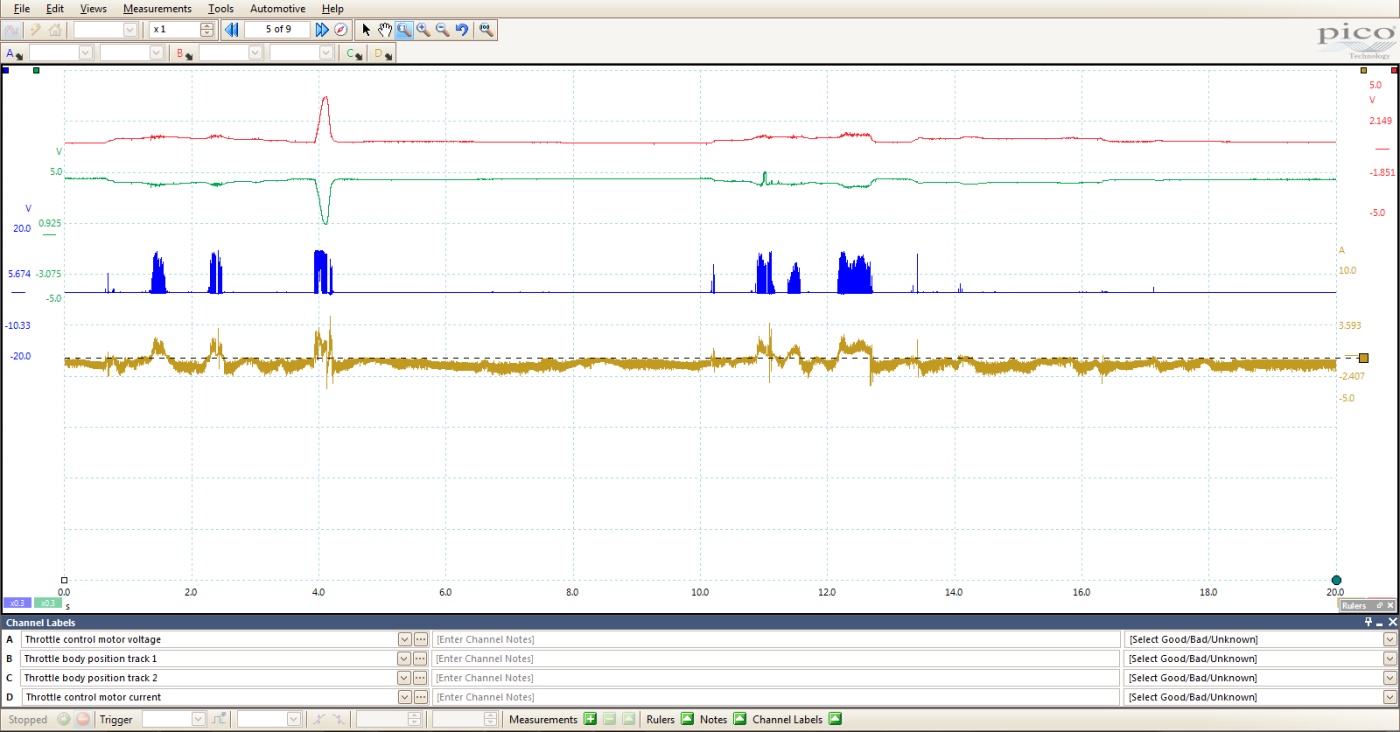
Next, the PicoScope was attached, monitoring the two tracks, the PWM signal to the motor for the opening signal, and the current of the motor. All measurements were taken at the throttle body for ease of access.

The screenshot above shows the engine revved at different stages, including wide open throttle with the vehicle at a standstill. No issues were detected, but it does demonstrate the two tracks adding up to 5 volts. You can also see that the current increases as the PWM increases at wide-open throttle events. If you had a free channel, you could measure the voltage applied to the throttle body during the throttle closing phase. This would fill in the gaps between the PWM measured here, but the effect is evident in the measured motor current as it goes to a negative value.
Another road test was carried out with both the scan tool and PicoScope attached, again mainly at 19% throttle position. The image below is the scan tool read-out when driving up a hill.
Again no issues were detected here.

Below is the capture of a similar period from PicoScope.
Here, we can see that at about 11 seconds, Track 2 has a very brief period where the voltage jumps to 5 volts.
Zooming in on this event revealed the following image:

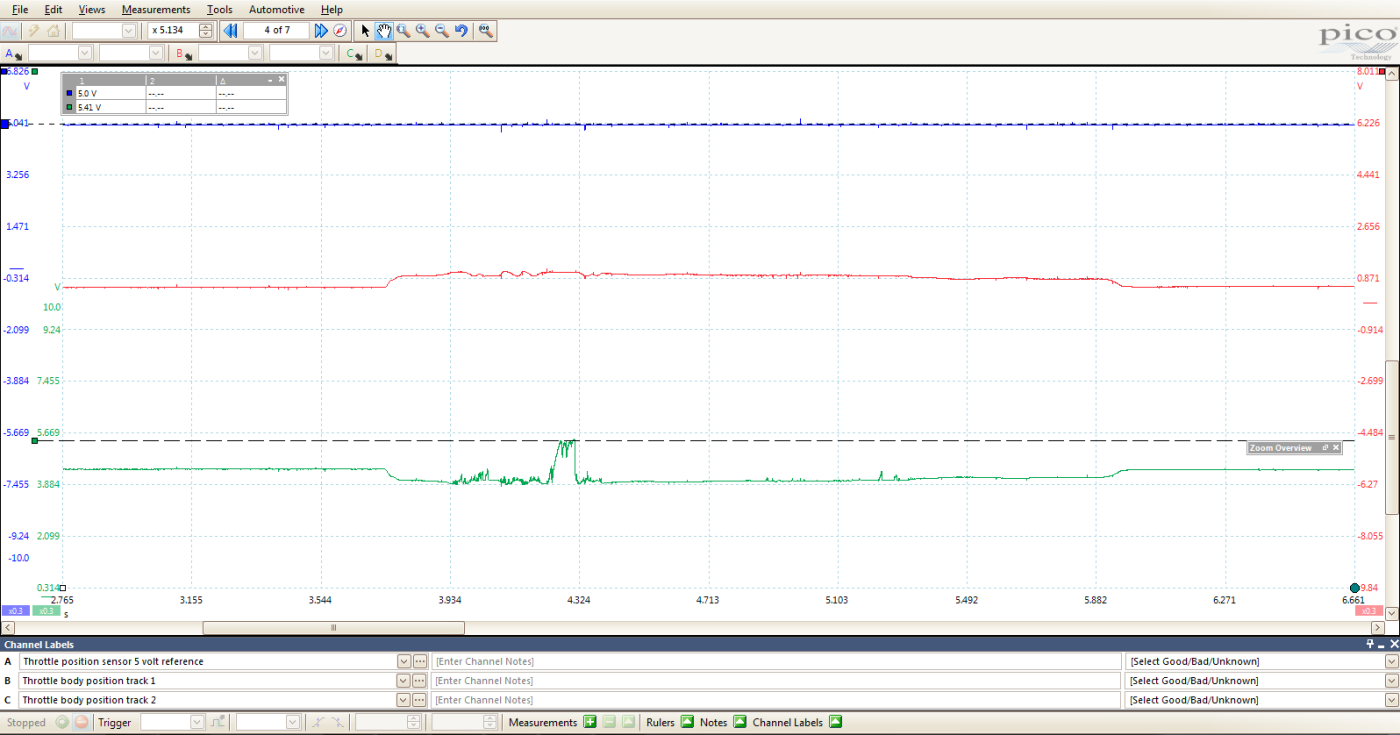
What is evident here is the voltage spike that actually goes above the 5 volts scale. Initially, to get more detail, a 0- to 5-volt range was used on this channel. We can also see that during this period the current is steady and does not suggest any form of shorting. More read-outs were taken with a 10-volt scale on both tracks and one of the channels was changed to measure the 5-volt reference which supplies both the tracks inside the throttle body.
By using the rulers, we can see the voltage, which should only work within a 0-5-volt range, peak at 5.41 volts. Perhaps this track is shorting to a higher voltage?
In this image, it is evident that the reference is a steady 5 volts so there is no chance of a short here. Previously we analysed the current of the 12-volt motor during a voltage spike, which did not suggest any issues. Another possibility is a short on Track 2’s circuit on the wiring or ECU.
The following image displays the two tracks and the 5-volt reference when the throttle body connector has been disconnected. This displays the bias voltage for the two tracks.

Track 2 displays a familiar number, 5.41 volts, so now we know what we were seeing was the signal jumping up to the bias voltage. This proves that there is an opening, somewhere from the potentiometer of Track 2 to the ECU. Normally when measuring a sensor, it is best to do so at the ECU so that you can see what the ECU sees.
This gives you as much information as possible. As previously stated, I measured at the throttle body, and on this occasion it was beneficial. If I measured at the ECU, I would still have questioned the wiring and connections from the throttle to the ECU. The throttle connections were found to be clean, tight and secure which proved the fault was within the throttle body. More evidence is that the voltage spike only occurred when the track was on 19% on the scan tool and about 4.1 volts on the PicoScope (these two figures support each other, as the 5 volt range minus the 4 volt position = 0.9 volt difference, and 19% of 5 volts = 0.95 volts). What this suggests, is that Track 2’s potentiometer has a worn spot on it. Unfortunately, the throttle unit could not be stripped for inspection without cutting a sealing metal band. This was not ideal, as the customer had requested it back. A new throttle body was fitted with a reset of the adaptives to rectify the fault.
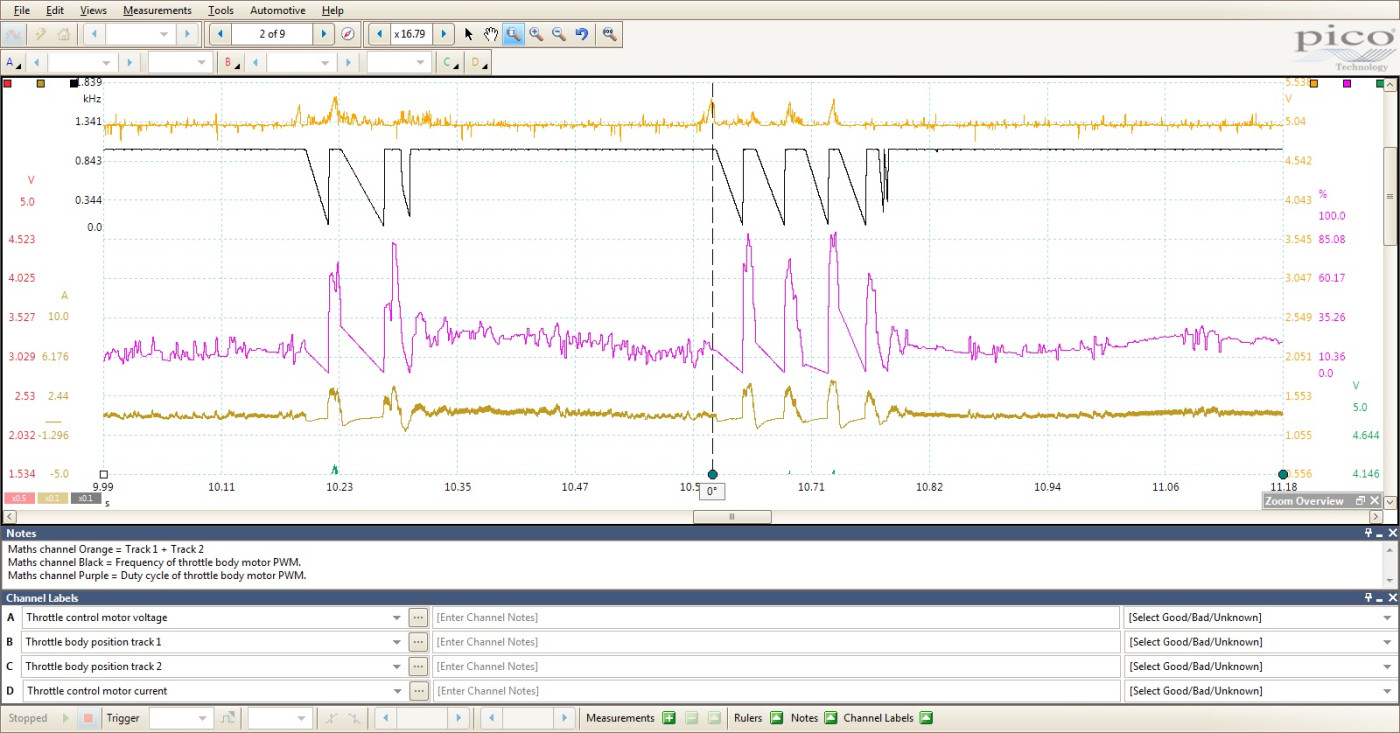
The above capture displays how you can utilize the PicoScope to reveal even more detail, should you need it. We can analyze the relationship between the measured position of the two tracks and the PWM to the throttle body. The first channel (orange) is used creating a math channel of B + C. We know these two tracks should add up to 5 volts. This channel should display 5 volts at all times, regardless of the throttle position. This is useful because during rapid pedal movements the voltage deviation is sometimes not always as clear. The second channel (black) is a math channel of the PWM of the throttle body motor opening supply voltage. This measures the frequency. The third channel (purple) measures the duty cycle “on time” of the same PMW signal. These two together control the position and current consumption of the motor. You can see how the injection computer responds to the deviations of the track voltage, by reducing the voltage and current through the motor until the track voltage is of a satisfactory value. You could compare this to the function of a scan tool, where you can see the set-point and measured value.
By using the zoom feature in PicoScope, we can clearly see the error on the throttle body track (the orange waveform which is Math Channel B+C) on the screenshot below..

Summary:
This case study demonstrates how useful the PicoScope can be when used correctly. The high speed gives its advantage over a scan tool. As the fault becomes more apparent, this issue would undoubtedly have been picked up by a scan tool. With the PicoScope, however, you can see the very start of certain problems without any symptoms at all, and at the same time fully analyze every detail and every aspect of the system you are working on. This ultimately gives you 100% confidence in the diagnosis.
When possible, you can utilize the freeze frame data to help reproduce a fault. With this case, the fault would only occur at 19% load and only when going up a hill, which I suspect was due to the additional heat and vibration created when the engine is under load.
The stored fault codes were for Tracks 1 and 2, yet the issue is with Track 2. Track 1 did not fault at all. I suspect this is because of the injection computer. As far as it is concerned, there is an excessive deviation from the totalled 5-volt value of the two tracks added together. However, both of the tracks are working within their parameters, so as a precaution both tracks are deemed to be potentially faulty. Not once did the warning light come on during testing, clearly there is a set limit for when it does. As the potentiometer is a mechanical wearing device, allowances need to be made to accommodate wear created by age and use. This means that the threshold for the fault code to appear is quite high.


