PicoScope 7 Automotive
Available for Windows, Mac, and Linux, the next evolution of our diagnostic scope software is now available.
Automotive guided tests
Library of examples on how to perform tests when using PicoScope.

Training
Our collection of training videos, articles, guides and information on training courses.

Waveform library
The Waveform Library is a global database of waveforms uploaded by PicoScope users.

Case studies
Real-life case studies show how the professionals use PicoScope to diagnose vehicle faults.

A to Z of PicoScope
Detailed description of various PicoScope software and hardware features.

Videos
Training resources and demonstrations on PicoScope and the Automotive Diagnostics Kit.

Newsletter
Archive of our monthly Automotive Newsletters.

Documentation
Download manuals, brochures, posters, and training materials.

Reviews and awards
Accolades for the preferred diagnostic tool for service centers and vehicle manufacturers.

Many thanks once again to those who could attend this Practical Pico session. I will go through the outstanding questions and hopefully clarify any outstanding queries.
If you did not get to tune in to our live-stream, you can watch the video here.
While a number of questions were not specific to the topic (Non-Invasive engine condition testing), I will add them accordingly.
Please forgive my failure to write down the names of those who raised questions and I sincerely hope these answers find you.
Question 1.
A question was raised about the minimum permissible battery voltage during cranking along with the PicoDiagnostics battery test results:
This is an interesting question, especially if you have previously captured the minimum battery voltage during cranking with a multimeter. In this scenario, we are likely to see a momentary average of the minimum voltage (or RMS), depending on the meter. With PicoScope, we have the ability to capture voltage at lightning speeds with numerous samples, where we acquire the true value of battery voltage at the instantaneous point of inrush current into the starter motor.
This has always been the case, but it was never visible with a multimeter and a number of technical publications refer to a multimeter value as the minimum cranking voltage rather than the scope (which was often considered overkill for cranking voltage measurements).
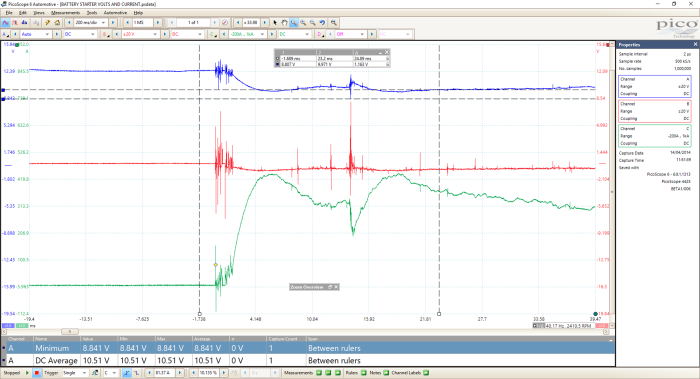
The capture below has a perfectly healthy battery voltage momentarily falling to 8.841 V yet the DC Average is 10 .51 V
Both PicoScope and the PicoDiagnostic battery test would capture and record this instantaneous low voltage but our multimeter could not. With that said, I think we would be happy to accept this momentary 8.841 V even though a number of technical publications might suggest we are approaching the limit of acceptance at 8.6 V.
We need to interpret the results obtained and apply them accordingly, on a case by case basis, underpinned by our theoretical knowledge. Had this battery voltage fallen dramatically to 8.6 V during initial cranking and continued to fall while cranking, we would most certainly hear alarm bells ringing. Using the scope means we have the ability to evaluate the effects on voltage over time, unlike the multimeter, which is the voltage at a specific time.
The following posts will help with how the Pico diagnostics battery test will evaluate and display your battery condition during the crank and start phase of an engine:
https://www.picoauto.com/support/post77701.html#p77701
https://www.picoauto.com/support/post57461.html#p57461
I hope this helps, and if I have misinterpreted the question raised please feedback when you can.
Question 2.
Dealing with the Fiat Twin Air “in-cylinder” pressure captures and multiple variables.
I am not sure how this came about, but I certainly scribbled it down on my pad during the live-stream. “Multiple variables” are some of the challenges we face with diagnosis, and engine evaluation is one such example.
Think about a vehicle that is presented to you with a misfire (combustion anomaly) and the initial data/scope traces that you capture on arrival.
These may lead you to a near conclusive diagnosis until you stop and think about the running condition of the engine and the PCM’s ability to compensate/mask the fault we are trying to diagnose.
We witnessed these exact same variables when testing the exhaust gas pulsations on Ben’s Mazda 3 Petrol with the 2.0-litre SkyActiv engine and his relative compression test.
On one occasion we increased the exhaust pulsations by blocking one of the tailpipes, then repeated the test the next day to find the complete opposite!
While I cannot explain the exhaust pulsation variations, I know the Mazda SkyActiv engine has some unique cylinder pressure characteristics post-startup, all of which can influence exhaust gas pulsations.
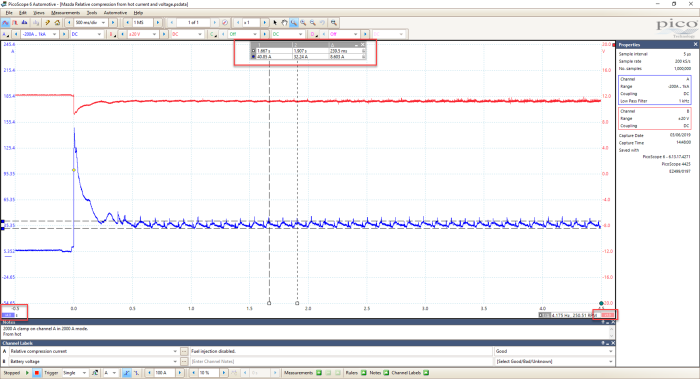
The relative Mazda compression test also threw us a curveball with very low compression peaks within the starter motor current.
Note the peak current flow during cranking at approximately 40 A and the peak-to-peak value of just 8.6 A between compression events!
With this in mind, here are some good practices to follow with any capture:
1. Blame your measurement technique first, look for measurement error, set up error and misinterpretation of results.
2. Blame your measurement conditions (e.g. hot/cold engine, the battery fully charged etc.).
3. Once you are happy the results are factual, then qualify the results against known good under identical test conditions (minimise the variables).
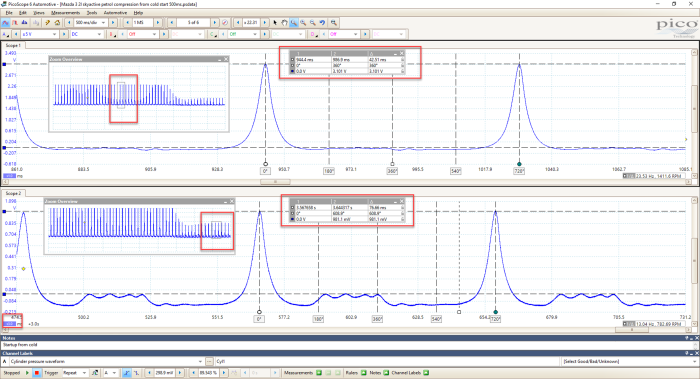
If you carry out an in-cylinder pressure measurement and start the engine of the Mazda SkyActiv unit, you will certainly notice a change in the exhaust tone approximately 20 seconds after startup (depending on temperature) accompanied with a change in cylinder pressure.
The image above highlights this intriguing event where a dramatic change in compression occurs (with minimal change in engine speed), thanks to throttle position and elaborate valve timing.
N.B. the WPS500 x voltage output above is 1 V per 100 psi / 6.894 bar.
A discussion with Mazda highlighted another clever feature of the SkyActiv petrol engine, whereby it has an anti-flood mode, allowing the engine to clear excess fuel from the cylinders after a partial non-start. Again, this is achieved via valve timing and throttle position whereby the engine appears to crank rapidly with very little compression. Imagine carrying out a compression test while the PCM is carrying out "anti-flood".
The Fiat Twin Air system was mentioned during the webinar as one of those vehicles demonstrating such variables whilst attempting to diagnose reported faults.
There is a fantastic case study here from Mark Stammers: https://markstammersdiagnostics.com/casefiles/fiat-twinair-misfire/, which highlights the additional challenges we face from the PCM when it comes to battling with variables. The Waveform Library has a number of Fiat Twin Air captures that may help should you find yourself up against these vehicles.
The included paragraph “The more I read up on the system, the more I had to think about ’cause or effect’, as this system has the ability to control the intake valve opening duration, advance/retard and lift, per cylinder per stroke! wow! What a challenge!” kind of sums up variables.
Another example of shifting variables is a vehicle that appears to be “falling apart” whilst in your care! The kind of vehicle that is driven in and then pushed out! The VW Polo Case study is one such example here: https://www.picoauto.com/library/case-studies/vw-polo-misleading-fault-codes
Let me summarise: product knowledge is invaluable and reduces diagnostic time. This is a good case for specialising in specific brands which by its nature, allows you to collect product knowledge that is not even documented but gathered through experience (awareness is key and king).
I hope this helps and I hope it goes some way to answering another challenging question.
Question 3.
Can you confirm the fluids that are compatible with the WPS500X Pressure Transducer?
If we follow the owner’s manual to the letter, page 8 states:
“Compatible fluid types
The WPS500X is suitable for use with the following types of fluid:
• Gasoline and diesel (low pressures only – see the warning on p. 2)
• Engine oil
• Air”
I guess the best way to approach this is to look at the construction of the WPS500X, which utilises Viton seals throughout. I have found the following link to the Wikipedia site that lists the general compatibilities of Viton seals (no doubt there will be others).
The WPS500X has not been tested for use with brake fluid and R134A gas. With this in mind, I have used the WPS500X to measure both brake fluid and R134A gas pressures with no effect on the transducer.
We have to be mindful of the corrosive aspect of the fluids we intend to measure (e.g. AdBlue), as the WPS500X’ housing/measurement chamber should also be considered as well as the seals.
In all cases of using the WPS500X to measure “other” fluids/gases, I would make sure that the unit is washed out thoroughly post-test to preserve the integrity of the measurement chamber and seals while also avoiding cross contamination.
The cleaning procedure can be found on pages 10 & 11 in the WPS500X User’s Guide.
Returning to R134A for a moment:
As an experiment, we have created the hoses below to enable the WPS500X to be connected to an Air Conditioning system! This opens up a whole new world for AC Diagnosis and training as we can capture pressure against time with superior resolution.

AC hose experiment
With reference to the following case study and using the specially adapted hoses above, a brief evaluation was made on the operation of the AC system at idle speed, with the cabin controls set to “Max Cool” with all the doors on the vehicle open. This will load the AC system as it attempts to cool down the atmosphere at an ambient temperature of 26° C.
The waveform below highlights the cooling fan operation, along with the pressure values contained within the High and Low AC pipework. Given the ambient temperature and the loading of the AC system, I would expect to see the high pressure to increase to approximately 10 bar and remain around 2 bar on the low-pressure side. Based on this quick evaluation in conjunction with poor cabin vent temperature, we recommended that the refrigerant level was inspected.
Analysing the AC pressures a little further, we can see that the compressor functions correctly. During the compressor’s “off stage”, the pressure equalisation time was approximately 12.5 seconds, which suggests no rapid equalisation as a result of internal compressor leakage between the input and output ports. The rise/fall time of the compressor during the “on stage” was also respectable at approximately 5 seconds with no dropout.
Please note, once again, that the WPS500X has not been tested with R134A refrigerant gas, but I can say that both these WPS500X units remain in use and have suffered no internal damage.
However, be aware of the maximum operating temperature of the WPS500X at 60°C, as this can be exceeded with AC measurements.
Question 4.
Before we begin, there are a number of do’s and don’ts when testing HV and EV vehicles.
Awareness, working environment, training, and current qualifications are paramount when testing HV systems as the safety to yourself and others cannot be compromised.
Prior to measuring HV systems, ensure the correct shutdown procedure has been followed as per the manufacturer instructions and confirm/qualify zero potential
For measuring current we have a number of AC/DC current clamps.
For voltage measurements, we have our Differential Probes for voltages up to 1400 V.
For AC current measurement of 3 phases simultaneously, we have the specialised AC 3-phase flex current probe.
There will be more to follow but that is enough said for now.
You can find an example of an automotive application of the 3-phase flex current probe here.
However, I must add that the Tesla Roadster used for this example had easy access to such cables. Other brands and models may have very limited or simply no access to each phase (depending on construction) and so other forms of testing are required.
The accessories above predominately apply to live measurements of voltage and current, which is most certainly relevant for glitch capture, intermittent errors and training.
In reality, vehicle manufacturer’s request that fault codes, serial data and flow charts are adhered to, combined with post-shutdown HV system testing (zero potential confirmed).
Testing of the three-phase motor/generator would, therefore, consist of insulation and micro-ohm measurements to confirm the integrity of the windings/assembly.
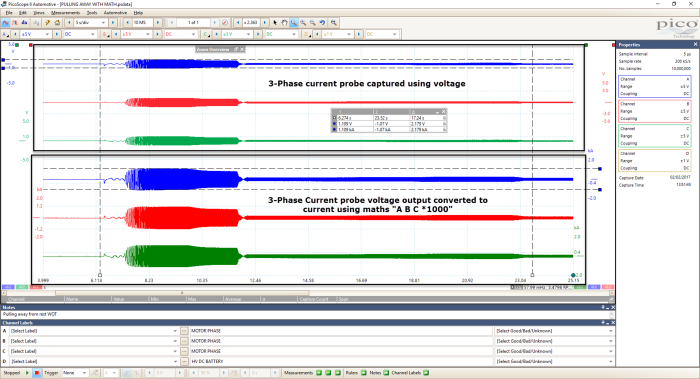
Now back to profiling current, using the Tesla capture in the link above with the 3-phase flex current probe (you could also use 3 x current clamps), I have used maths to profile the RMS current flow via the motor windings (the equivalent DC current).
Given that the 3-phase flex probe and DC current clamps were originally used without the relevant custom probe settings, I have converted the values captured on channels A, B, C and D from voltage into current (probe output 1 mV/A).
Channel A, B, C and D are therefore multiplied by 1000 and converted to amps using the formulas A, B, C and D*1000.
Below we have the 3-phase current measurement converted from voltage to current.
To calculate the RMS current we then use the math channel formula:
“sqrt(integral(A^2)/T)+sqrt(integral(B^2)/T)+sqrt(integral(C^2)/T)*(1000)”
We can now graph the equivalent DC current through the windings of the motor/generator, creating a “profile”.

3-phase current graphing/profiling
Please don’t be put off by the math channel formula, it is the same as this single phase measurement here only repeated three times for three phases. N.B. The x1000 at the end of the formula is to increase the final values due to the initial probe settings using voltage rather than current (1 mV/A).
Having this formula loaded into your math channel library will be useful for other 3-phase applications such as fuel pump and VVT actuators that utilise 3-phase motors.
Many thanks again to Martyn, Pete and Ben here at Pico for their support with the above.
I hope this helps,
We will be answering more questions in time, so please keep watching our Practical Pico videos and live-streams and keep the questions coming.
Take care…
Steve