PicoScope 7 Automotive
Available for Windows, Mac, and Linux, the next evolution of our diagnostic scope software is now available.
Automotive guided tests
Library of examples on how to perform tests when using PicoScope.

Training
Our collection of training videos, articles, guides and information on training courses.

Waveform library
The Waveform Library is a global database of waveforms uploaded by PicoScope users.

Case studies
Real-life case studies show how the professionals use PicoScope to diagnose vehicle faults.

A to Z of PicoScope
Detailed description of various PicoScope software and hardware features.

Videos
Training resources and demonstrations on PicoScope and the Automotive Diagnostics Kit.

Newsletter
Archive of our monthly Automotive Newsletters.

Documentation
Download manuals, brochures, posters, and training materials.

Reviews and awards
Accolades for the preferred diagnostic tool for service centers and vehicle manufacturers.


WPS500X Pressure Transducer Kit (with carry case)

WPS500X Pressure Transducer
*At Pico we are always looking to improve our products. The tools used in this guided test may have been superseded and the products above are our latest versions used to diagnose the fault documented in this case study.
The purpose of this test is to evaluate the in-cylinder pressures of a gasoline engine during a snap throttle test using the WPS500X pressure transducer.
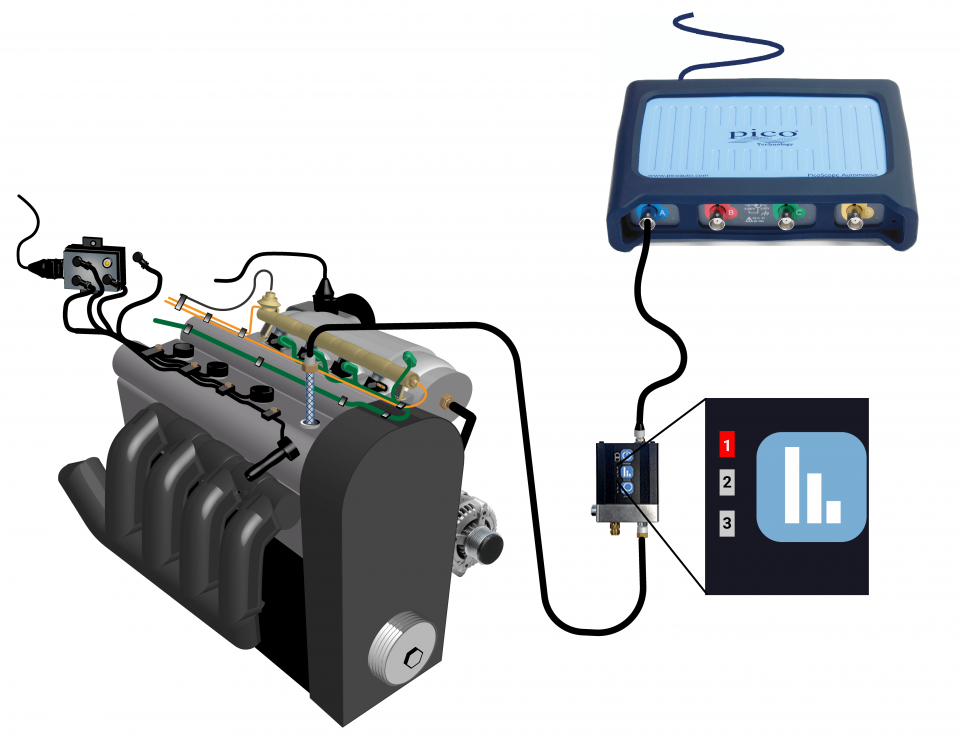
View connection guidance notes.
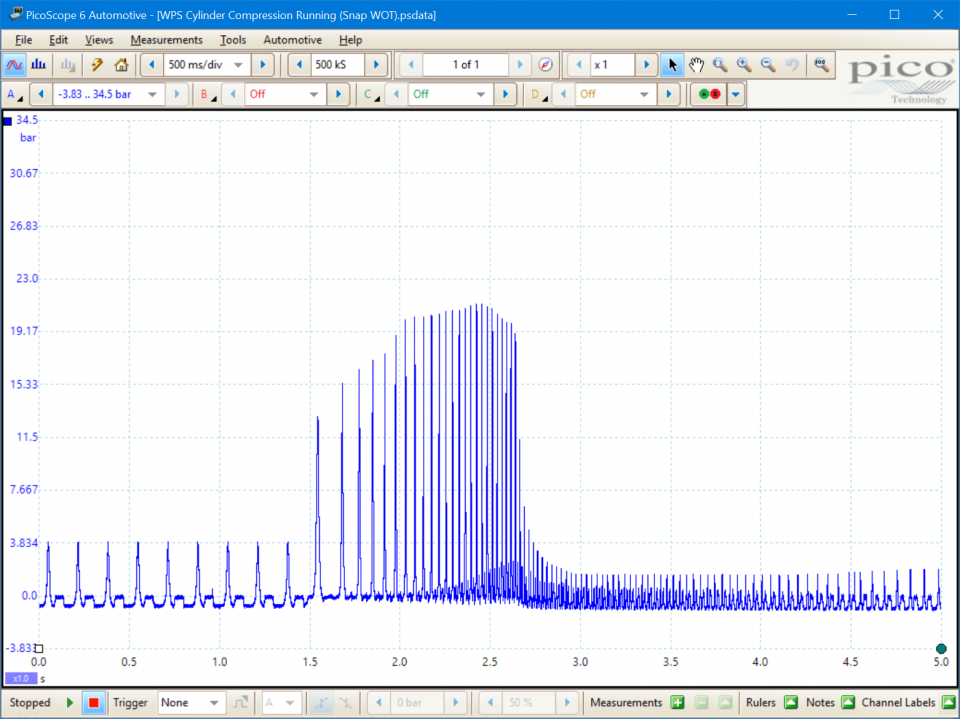
This known good waveform has the following characteristics:
Go to the drop-down menu bar at the lower left corner of the Waveform Library window and select Cylinder pressure waveform.

When used with a snap throttle test, a WPS500X allows you to observe how in-cylinder pressures change over a range of air flows in and out of the engine.
Waveform analysis
It is possible to use PicoScope’s Zoom, Rulers, and Rotation rulers to analyse and identify similar features in your waveforms to those described in the In-cylinder pressure during cranking (gasoline) and In-cylinder pressure during idle (gasoline) guided tests. However, the snap test waveform allows us to look at other broader trends that occur as the air flow and engine speed change.
Waveform features
When captured during a snap throttle test, the relationship between the in-cylinder pressure waveform features and engine events can be described in turn, as follows:
It is possible to use the maximum pulse pressure to estimate the engine load during any given engine cycle within the waveform. For example, if the maximum pressure was 21 bar and the peak pulse pressure at idle was around 4 bar the calculated value is around 4 / 21 x 100 = 19 %, which is a typical engine load during idle.
When two Rulers are placed on the time axis, the Frequency legend indicates the equivalent cycle frequency calculated from the time period (delta) between the rulers. The frequency is displayed in units of hertz and RPM. Therefore, if rulers are placed at two consecutive pulse peaks, which are separated by 720° of crankshaft rotation, the RPM value indicates half the average engine speed over the period.
Note
Actual pressures vary with engine and test conditions. Only make pressure value decisions based on comparison with manufacturer data.
GT892-EN
Disclaimer
This help topic is subject to changes without notification. The information within is carefully checked and considered to be correct. This information is an example of our investigations and findings and is not a definitive procedure.
Pico Technology accepts no responsibility for inaccuracies. Each vehicle may be different and require unique test
settings.
We know that our PicoScope users are clever and creative and we’d love to receive your ideas for improvement on this test. Click the Add comment button to leave your feedback.


