PicoScope 7 Automotive
Available for Windows, Mac, and Linux, the next evolution of our diagnostic scope software is now available.
Automotive guided tests
Library of examples on how to perform tests when using PicoScope.

Training
Our collection of training videos, articles, guides and information on training courses.

Waveform library
The Waveform Library is a global database of waveforms uploaded by PicoScope users.

Case studies
Real-life case studies show how the professionals use PicoScope to diagnose vehicle faults.

A to Z of PicoScope
Detailed description of various PicoScope software and hardware features.

Videos
Training resources and demonstrations on PicoScope and the Automotive Diagnostics Kit.

Newsletter
Archive of our monthly Automotive Newsletters.

Documentation
Download manuals, brochures, posters, and training materials.

Reviews and awards
Accolades for the preferred diagnostic tool for service centers and vehicle manufacturers.

You might all be intrigued by the subject of this article. The reason behind it is that I wanted to share a technique that I discovered while spending a lot of time researching better ways to diagnose 3-phase motors. I found that there is a very simple way to do this, and after sharing it with the team here at Pico, Steve Smith kindly named it the Martins Method after yours truly. So, let's get started.
The Martins Method drew upon existing math for plotting the relationship between current phases of 3-phase motors. Known as the Park Vector Approach it comprises two formulas:
• iD = (sqrt(2)/sqrt(3))A-(1/sqrt(6))B-(1/sqrt(6))C
• iQ = (1/sqrt(2))B-(1/sqrt(2))C
Where i = current and D and Q are just components for the formula.
These two formulas have to be set up correctly in the math channel wizard and have to take in account the range used in the channels and has to match. Other complications also arise from the fact that it's math, which means that if we’re watching it live, there is a delay while the software draws the math from the raw data. The most important part of the Park Vector Approach is that you have to use XY to view the result. At the time of writing XY hasn't yet been implemented into PicoScope 7 Automotive, so the following images will all still be from PicoScope 6 Automotive. Needless to say, it will be added and it will be awesome when it arrives, but for the time being, we will have to stick with PicoScope 6 Automotive when we need to use XY. The following Park Vector captures were done in controlled conditions using a 3-phase motor powered by a VFD unit and not from a vehicle.

The first capture shows a 3-phase motor during start-up, and what we are seeing is the current relationship between the phases forming a spiral as the current increases. This is highlighted when we load the motor further.
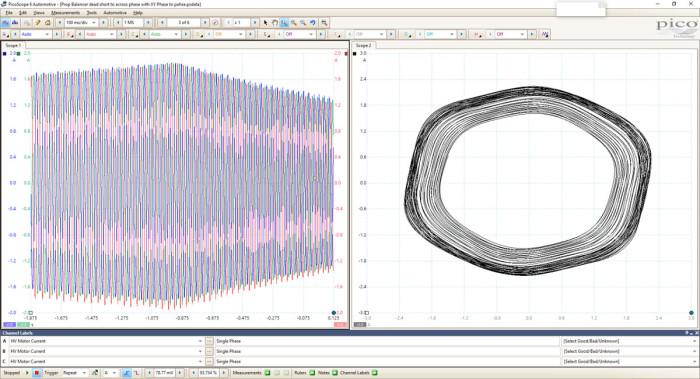
This is a great image as it's so clear and easy to see issues that might arise. However, the hurdle is the fact that it's math. When PicoScope captures data in block mode, (typically anything under 200ms/div) we get an update at the time but the streaming of the math is created at the end of the buffer and waits till the next buffer is full before drawing again. You also have to reset the math for each motor, as the current levels might be different. This is not much of a problem post-capture but we want to view issues in real time. This got me thinking. What would the current phases look like if they are compared directly with no maths involved?
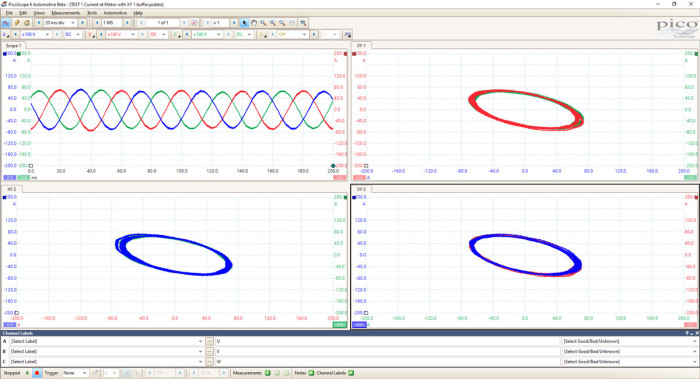
It may not be a perfect circle but you can see the relationship between each of the phases relevant to another. We have V & W against U, U & W against V and finally U & V against X. The great thing about using XY is that it is drawn in real time. This means that if you were to start a motor from rest and were streaming data at say 500ms/div, you will actually see the pattern being drawn on the screen. This type of waveform is known as a Lissajous pattern. They are typically used to calculate the phase difference between two sinusoidal signals with the same frequency but I've yet to see them being used for motor analysis.
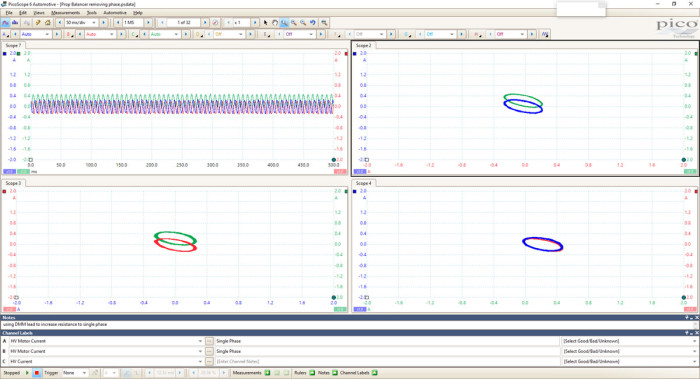
The use of XY can help us spot issues with motor balancing as in a correctly operating motor, the waveforms should sit on top of each other. Below is an example of when the current is different in a phase:
And what happens when you lose a phase:
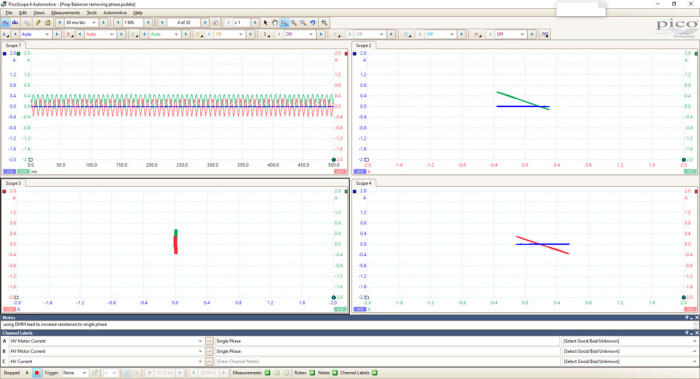
I know 3-phase motor testing is difficult on some vehicles and impossible on others, but where it is possible, applying the Martins Method could offer some quick detail on the motors you are troubleshooting.
It doesn't stop there though. We can also apply the Martins Method to another component found on the majority of electrified vehicles; the resolver. You may have seen our Resolvers Unwrapped article on our website or in our newsletter. Right near the bottom, I included an animation demonstrating how the two signals are used to determine position.
In the corner you can see the circle being drawn in, yes you guessed it, I was using the XY view. However, we have an issue with maths.
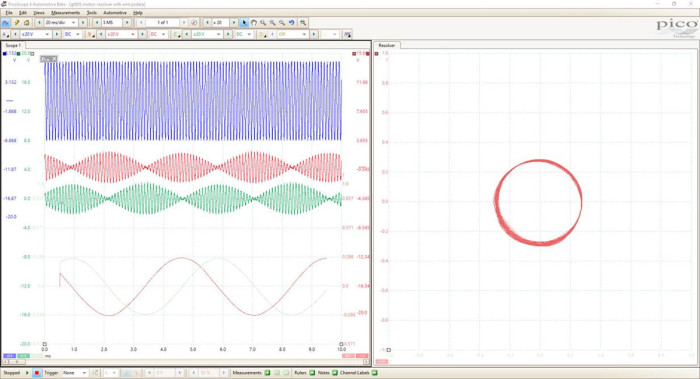
The nice thing about the maths, though, is that we have removed the excitation frequency which leaves us with the actual signal the ECU is seeing. Details on this math can be found in the Electric Vehicle section in our PicoScope 7 Guided tests. The result is a perfect circle and it is very clear when something goes wrong. We can also apply the Martins Method to the raw signal. As the signals are 90 degrees apart, the software will still draw a circle but it will appear to be filled in.

It is, however, important to note that you have to make sure that the grid for the XY view is perfectly square. You can adjust the size by clicking the left edge of the view and pulling it in. Otherwise, you can get more of an ellipse than a circle! You can see an example of a bad 3-phase motor featured in Miki Diosy's case study video.
The screenshot below is the capture of the resolver in XY view.
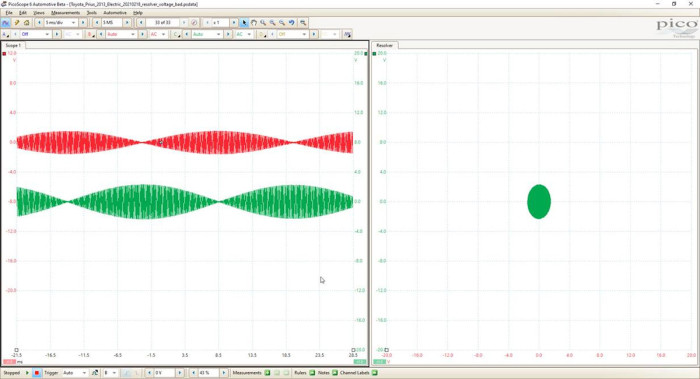
As you can see, it's quick and easy to determine that something is wrong, and best of all you can draw a mask in XY which means that you can load a known good, draw the XY and carry out the capture to quickly determine whether there is an issue or not.
To add an XY viewport in PicoScope 6 Automotive, click Views > Add View > XY:
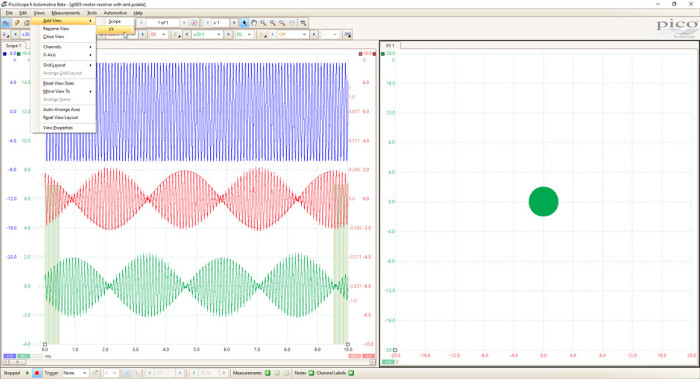
From here you may need to adjust the grid layout. This is made a lot simpler in PicoScope 7 but in PicoScope 6 you click Views > Grid Layout > Custom Layout:
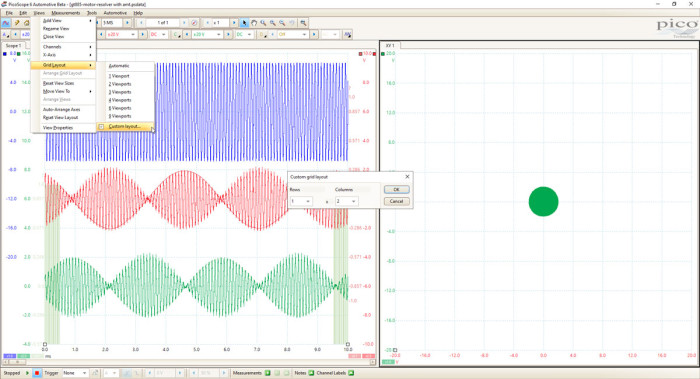
Now you can edit the layout. I find that 1 Row x 2 Columns works best for this type of view.
Once you have the XY view where you want, you need to select the channel you would like to put on the X-axis. You can do this by right-clicking on the XY grid, select X-Axis and then the channel you would like to use. You can then hide any other channels that are not of interest, which in the resolver file would be Channel A and the math channel.

I hope this makes sense and is of help to you. To give you the chance to play around and see if the Martins Method could be useful to you, I have attached a PicoScope 6 capture of a resolver that you can use.


