PicoScope 7 Automotive
Available for Windows, Mac, and Linux, the next evolution of our diagnostic scope software is now available.
Automotive guided tests
Library of examples on how to perform tests when using PicoScope.

Training
Our collection of training videos, articles, guides and information on training courses.

Waveform library
The Waveform Library is a global database of waveforms uploaded by PicoScope users.

Case studies
Real-life case studies show how the professionals use PicoScope to diagnose vehicle faults.

A to Z of PicoScope
Detailed description of various PicoScope software and hardware features.

Videos
Training resources and demonstrations on PicoScope and the Automotive Diagnostics Kit.

Newsletter
Archive of our monthly Automotive Newsletters.

Documentation
Download manuals, brochures, posters, and training materials.

Reviews and awards
Accolades for the preferred diagnostic tool for service centers and vehicle manufacturers.

While we never stop learning in this ever-evolving trade of ours, we have to bring Scope School to a close. So I want to finish off by talking about some of the tips and tricks of PicoScope that can make life easier as you develop with this essential tool.
In this final chapter I’ll cover some capture and analysis features that I am sure you will find invaluable during your diagnosis.
The Coupling option is located next to the voltage range control. The default DC setting allows the scope to display both the DC and AC aspects of the input signal. Selecting the AC coupling option we block the DC component of the input signal and allow only the AC to be displayed on screen.
As an example of the value of this feature, connect Channels A and B of your scope across a 12 V battery and start the engine (enabling the alternator to commence charging). Leave the coupling option of Channel A set to DC (±20 V) and select AC coupling for Channel B (±500 mV). Channel A will display the DC voltage, and Channel B will display the AC voltage across the battery revealing the alternator ripple. We are measuring the same voltage but gaining the value of two properties from it. Applying this coupling feature to fuel rail pressure sensors and certain active wheel speed sensors will reveal much more.
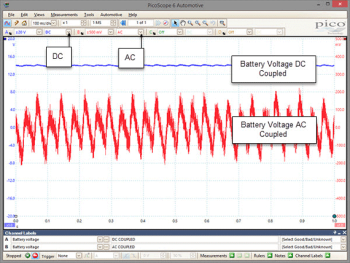
Figure 1
There may be times during scope use where you miss the event you were trying to capture. This could be a momentary misfire or drop in signal while wiggle testing a wiring harness. Stopping the capture and using the buffer feature enables you to scroll back through time, a screen at a time. PicoScope stores the last 32 screen captures (or more, depending on scope settings), allowing you to scroll through your data to find and view the waveform with the misfire or signal dropout; this is the proof needed for you and your customer.

Figure 2
Reference waveforms are a great way to help you compare a known good waveform against your captured suspect waveform, on the same screen. With your known good waveform on screen, select Tools > Reference Waveforms and then select the waveform channel of interest from the Available list. Now click the Duplicate button and tick the box adjacent to your highlighted waveform in the Library list, then click OK.
A duplicate of your known good waveform will appear (and remain) on screen while you capture a suspect waveform for comparison.

Figure 3
Often when reviewing waveforms the valuable detail is hidden until we zoom, measure or filter. Zooming is an invaluable tool as we mentioned last month, but can add confusion when trying to keep track of the general perspective of the whole waveform (the zoom overview does help here). However, by using the scaling feature of PicoScope you can adjust the individual scales of each channel, revealing additional detail of each waveform while maintaining the original size of the overall capture.
Figure 4 shows Channel A secondary ignition waveform as captured with very little detail visible:

Figure 4
Figure 5 shows the same Channel A secondary ignition waveform after the scale has been increased 6 times (x6.0), while the overall waveform view (screen size) remains unchanged.
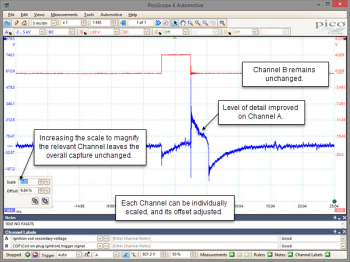
Figure 5
Note: As you adjust the scaling you may have to adjust the offset to keep your waveform on screen. The quickest way to do this is to drag the channel axis (the column of numbers to the left or right of the grid) up or down.
The alarm feature of PicoScope can be used to emit a beep (or any .wav file of your choice) when your waveform meets its trigger criteria. Good uses for this are intermittent problem vehicles which often run fine with the test equipment attached. The alarm feature allows you to walk away from your diagnostic setup, safe in the knowledge PicoScope will alert you with an audible warning when a fault occurs.
To do this set your trigger as normal, then under Tools > Alarms enable the Beep option and then the Capture option (under Event). Confirm by clicking Apply and OK.

Figure 6
A waveform has countless pieces of information contained within it. You may wish to share and highlight specific areas of interest within the waveform for customer proof, or to reference at a later date. You have three ways to highlight areas of interest:
Clicking the Measurements button will reveal the Add Measurement options. Select the channel you wish to add a measurement to, the type of measurement (Figure 7 shows the maximum voltage), and the area of the waveform you would like to measure (I have chosen the whole trace). Click OK after your selection to add your chosen measurement to your waveform as a numerical value. This will remove any guesswork and can be done before, during or after capture.

Figure 7
Clicking on the Notes button will open a text field entitled Notes, in which you can type any text you choose. Information that will assist with future referencing, sharing, training, or warranty return is ideal.

Figure 8
Clicking the Channel Labels button will open the channel identification fields, allowing you to quickly label each channel from a list of predefined descriptions. You can then add a comment about the label and highlight whether the signal was Good, Bad or Unknown.

Figure 9
Arguably one of the best new features added to PicoScope 6 Automotive is Rotation Rulers. The Rotation Rulers allow you to identify the start and end time of a particular interval of interest within your waveform.
A typical example of their use is a compression waveform, knowing that in 720° of crankshaft rotation we will see the complete four-stroke cycle.
The turquoise Rotation Ruler handle is located at the bottom right of the scope screen. Drag two of these Rotation Rulers onto your waveform to denote the start (0°) and end (720°) of the engine’s four stroke cycle.
With the 0° and 720° rulers in place click on the Rulers button on your tool bar, and increase the number of Rotation Partitions to 4. PicoScope places additional rulers distributed equally between the 0° and 720° markers to give you the BDC and TDC points throughout the 720°, revealing the events in your compression waveform during the four stroke cycle (Compression-Power-Exhaust-Intake).
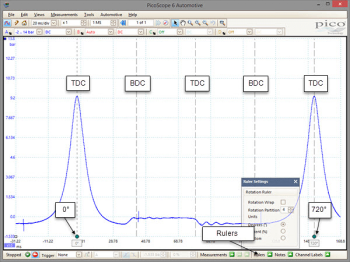
Figure 10
Another great new feature is the Automotive Waveform Library. There are countless times when it would have been useful to have a comparison waveform for a circuit under test. Often this would involve sifting through your own library, or ringing round colleagues in the hope someone may have the waveform you are after.
PicoScope 6 Automotive 6.9 now contains a feature called Waveform Library Browser found under the File menu. This new feature will enable you to search a global database of waveforms that have been uploaded by PicoScope users from around the world.
Once logged into the Waveform Library Browser you will find numerous search options allowing you to locate a relevant waveform for a specific manufacturer or model. With your search criteria filled in, click on the Search button. You are then presented with a selection of waveforms that match your search options.
If you wish to set one of the search results as a reference waveform simply click the Load button to load it into your existing capture. Alternatively, click the Open Waveform button to open the waveform in your current scope screen with all Voltage, Time, Trigger, and Probe settings appropriately set.
Not only can you browse waveforms, but equally important you can contribute by uploading and sharing your own captures, assisting other users around the world.

Figure 11


