PicoScope 7 Automotive
Available for Windows, Mac, and Linux, the next evolution of our diagnostic scope software is now available.
Automotive guided tests
Library of examples on how to perform tests when using PicoScope.

Training
Our collection of training videos, articles, guides and information on training courses.

Waveform library
The Waveform Library is a global database of waveforms uploaded by PicoScope users.

Case studies
Real-life case studies show how the professionals use PicoScope to diagnose vehicle faults.

A to Z of PicoScope
Detailed description of various PicoScope software and hardware features.

Videos
Training resources and demonstrations on PicoScope and the Automotive Diagnostics Kit.

Newsletter
Archive of our monthly Automotive Newsletters.

Documentation
Download manuals, brochures, posters, and training materials.

Reviews and awards
Accolades for the preferred diagnostic tool for service centers and vehicle manufacturers.

After following a second forum post regarding the BMW F31 N47 low-pressure Fuel Pump Controller and CAN ID 3 35, it became impossible to ignore the temptation to dig a little deeper into the data field (payload) associated with this ID.
Here is the summary of the second forum post:
Since we had proven that this ID was relative to the operation of the fuel pump, I wrote this piece to share my attempts on deciphering the data field associated with CAN ID 3 35.
We carried out an active test through a scan tool with installed battery support and with the engine off. The scan tool provided three options to run the fuel pump: 60 L/H, 120 L/H and at full rate (no duty control).
In this screenshot, you can see the low-pressure fuel pump running at a delivery rate of 120 L/H.
The fuel pump is driven via the Fuel Pump Controller using a positive duty cycle. You can see this in the black math channel that I have included in the capture above. If you want to know more about duty math channels, see here. I removed the minus symbol from the formula as we require positive duty for this type of fuel pump.
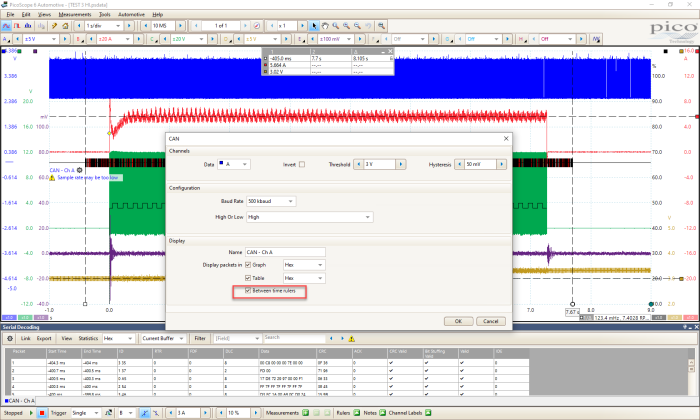
Now, let us look at decoding the data field from the fuel pump controller (CAN ID 3 35). I used decoding "between the time rulers” during fuel pump activation. You can find more information and tips on decoding here.
You can see the decode settings for the CAN traffic present with the fuel pump active:
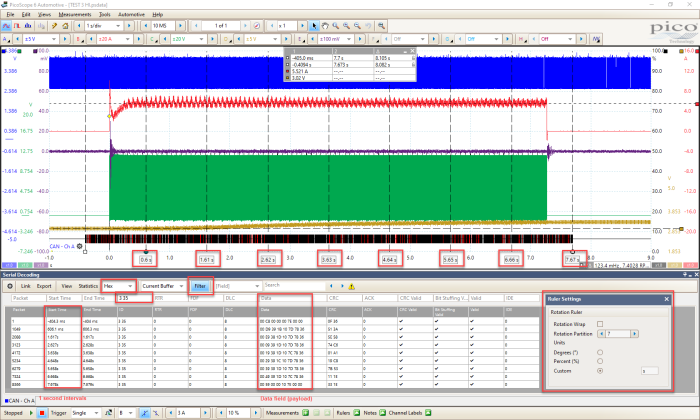
In the capture below, I have added a filter to the decode table to display only ID 3 35 (between the time rulers), allowing for complete focus on these relevant data packets.
Notice how the CAN ID 3 35 is transmitted on the CAN bus, both when the fuel pump is activated and static, and how the data field (payload) is continually updated at 1-second intervals during fuel pump operation. I used the rotation rulers and partitions (I customized their values, which are typically degrees, to seconds) and positioned them on the graph to denote the start time of each of the fuel pump controller transmissions (post trigger). This helps to relate the transmission rate of the CAN messages from the fuel pump controller to fuel pump activity.
So, how do we translate the data field into human-readable data?
Without the proprietary database file (.dbc file) from the vehicle manufacturer, the answer is “with a lot of hard work and a little luck!".
Initially, we need to understand how the data field in our decode table represents human-readable data, in this case, decimal values.
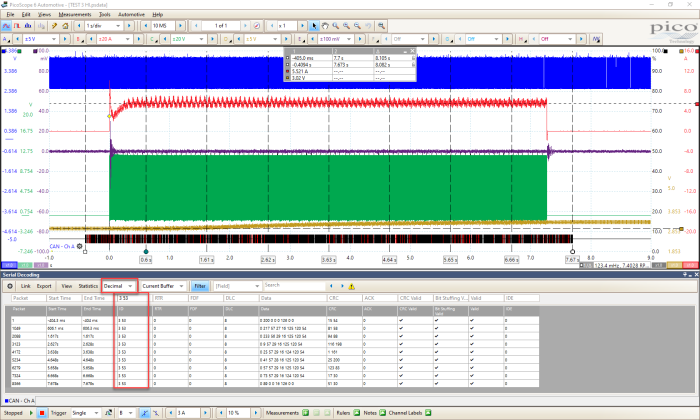
The quick way is to change from hexadecimal to decimal in our decode table. However, remember that our CAN ID of 3 35 becomes 3 53 in decimal (therefore, you need to filter for 3 53 decimal, not 3 35 Hex).
I guess the next question is: how does ID 3 35 (hex) become 3 53 (decimal) and why bother?
The main reason we use hexadecimal is that we can represent huge numbers with fewer digits, which makes for easier interpretation as humans. While the PicoScope decode table can represent data in hex, binary, decimal & ASCII, using just two digits of hexadecimal simplifies the display for analysis.
For example, the decimal number 12,500 is 0000 1101 0100 in binary or 30D4 in hexadecimal.
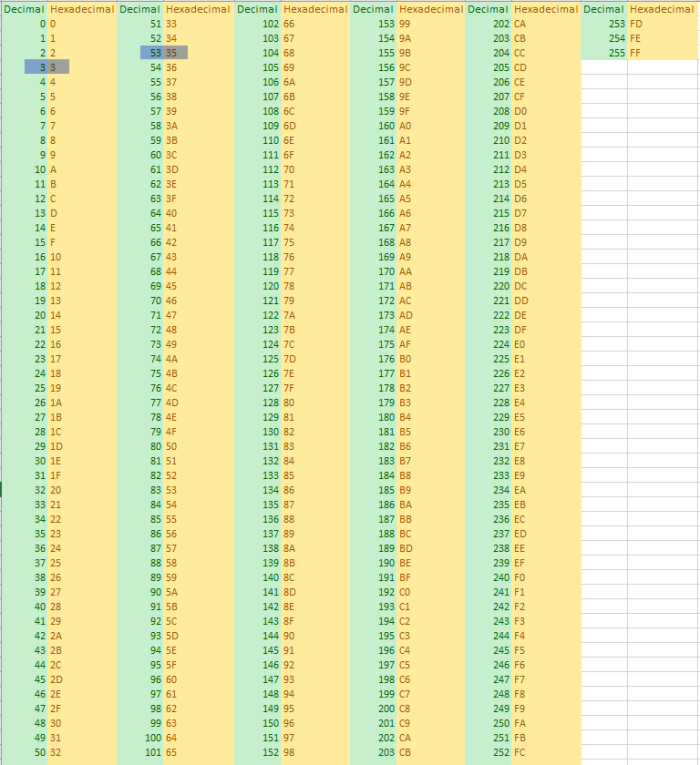
Below we have a reference table that will help with the conversion of hexadecimal to decimal values where two digits can represent 256 different values (including zero). Note, I have highlighted the conversion of our CAN ID 3 35 (hex) to CAN ID 3 53 (decimal).
Before I go on, we often see digits/values represented as 0x52 or 0x98. The 0x denotes that the displayed values are hexadecimal as without letters (A to F) it may not be immediately apparent (0x52 = 82 decimal and 0x98 = 152 decimal).
I am going to return to the decode table in hex (Figure 3), rather than decimal, to explain how these two digits refer to data bits, nibbles and bytes and how they can represent 256 different values. I hope this will bring clarity to how the CAN data/payload is constructed, assigned and interpreted.
Our typical CAN message will consist of 8 bytes of data. With Figure 3 above as an example, we can see that the Packet 1 Data Length Code DLC = 8 bytes of data transmitted within this packet.
Note, CAN packet refers to the entire CAN frame consisting of:
ID, RTR, FDF, DLC, Data, CRC, ACK, CRC Valid, Bit Stiffing Valid, Valid & IDE.
The Data Field contains multiples of two digits (hex) grouped to represent each data byte (8 bytes in total).
Packet 1 Data bytes = 00 C8 00 00 00 7E 00 00
Each byte consists of 8 bits (1 bit is the smallest building block of computer storage) either a binary 1 or 0 (CAN differential voltage 0 V or 2 V respectively), which is the language of the CAN network controllers.
It is worth noting here that the 8 bits are split in two, each part consists of 4 bits each and is referred to as a “Nibble” (half a byte).
So, how does hexadecimal represent decimal units using binary values and why bother?
Once again, it's all about ease of human interpretation of the hypnotic binary system (computer language to human language).
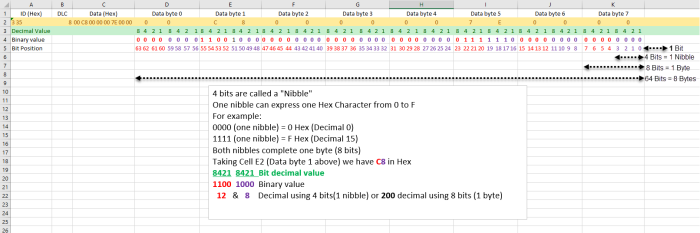
The following image splits the Data/Payload into each of the 8 bytes numbered from Byte 0 to Byte 7.
We also include the decimal/binary values, bits grouped into nibbles & bit numbering/position.
Let’s take a look at the Data/Payload above and in particular Byte 1 0xC8 (200 decimal).
|
C 8 |
|
8 4 2 1 8 4 2 1 (bit decimal value) |
|
1 1 0 0 1 0 0 0 Binary (1 or 0) consisting of 8 bits (1 byte) grouped into 2 nibbles (4 bits). |
To calculate the decimal value of 0xC and 0x8, we need to add the decimal units represented by each binary bit. C is therefore equal to 8 + 4 + 0 + 0 = 12, while 8 = 8 + 0 + 0 + 0 + 0 = 8 however 12 and 8 is not 200!
So how does the computer know whether the hex value C8 = 200 or C = 12 and 8 = 8?
This all comes down to manufacturer coding and how the relevant controllers have been instructed to interpret the data transmitted on the CAN network. You may notice the “Bit Position” numbering under each byte in the image above. The bit position numbering sequence will vary between manufacturers and this is where the .dbc files become invaluable. However, for this exercise, we will assume they are numbered as above.
Let’s assume Byte 1 represented by 0xC8 (200 decimal) equates to a target fuel delivery of 200 litres of fuel per hour transmitted from the fuel pump controller. The controller will have been programmed to transmit this value in the form of 8 bits of data (one byte).
Note: We will prove later that Byte 1 does not equate to fuel delivery.
For those ECU's on the network that are interested in "Target Fuel Delivery", they will have been instructed to look at Byte 1 from ID 3 35. Starting with bit number/position 48 with a length of 8 bits (bit 48 to 55) Remember 8 bits (two hex digits) can represent 256 different values (including zero) and this is referred to as 8-bit resolution.
Think now about the fuel delivery rate of our fuel pump. Let us use 0 to 200 L/H (maximum) which we can represent with 8 bits. 200 L/H / 256 = 0.781 L/H increments of fuel delivery. This may be overkill, and while we have 256 increments at our disposal (with 8-bit resolution) we may only utilize 200.
If 4 bits were used instead of 8, the ECUs on the network that are interested in "Target Fuel Delivery" will have been instructed to look at Byte 1 from ID 3 35. But this time starting with bit number 48 with a length of 4 bits (bit 48 to 51). Remember that 4 bits (1 hex digit) can represent 16 different values (including zero) and this is referred to as 4-bit resolution.
200 L/H / 16 = 12.5 L/H increments of fuel delivery, which is insufficient for finite control of the fuel delivery rate.
The resolution will vary depending on the data transmitted, the more bits utilised to represent the data, the more accurate and fine the measurement will be:
For example:
Headlights On or Off can be represented sufficiently with 1-bit (1-bit resolution) 1=On 0=Off
What about Engine speed (Rpm)?
4-bit resolution = 24 = 16. A resolution of 4 bits can encode an analogue input to one in 16 different levels (0-15.) 0-6000 rpm / 16 = 375 rpm. In other words, rpm can be resolved down to 375 rpm intervals.
8-bit resolution = 28 = 256. A resolution of 8 bits can encode an analogue input to one in 256 different levels (0-255). 0-6000 rpm / 256 = 23.44 rpm. In other words, rpm can be resolved down to 23.44 rpm intervals.
12-bit resolution = 212 = 4096. A resolution of 12 bits can encode an analogue input to one in 4096 different levels (0-4095). 0-6000 rpm / 4096 = 1.465 rpm. In other words, rpm can be resolved down to 1.465 rpm intervals.
16-bit resolution = 216 = 65,536. A resolution of 16 bits can encode an analogue input to one in 65,536 different levels (0-65,535) 0-6000 rpm / 65,536 = 0.092 rpm. In other words, rpm can be resolved down to 0.092 rpm intervals.
As you can see from the information above, depending on the resolution required for the relevant sensor/actuator, the appropriate bit resolution will be chosen.
So how does this all relate to converting the fuel pump controller message into human-readable data?
I mentioned at the start of this post that a little luck may be required where no .dbc file is available.
By using the scan tool to operate the fuel pump, I quickly recognized a pattern in the decimal values of the data field (payload) and the values displayed for fuel delivery rate during the active test!
Here is a summary:
ID 3 35 is transmitted every 1 second during pump operation.
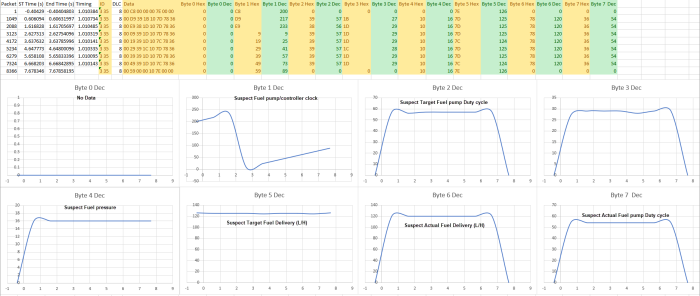
Byte 0 no change, remains fixed at 0x00 throughout pump operation.
Byte 1 pump on or off cycles through hexadecimal values C8, D9, E9, 9, 19, and so on (with increments of 16 in decimal).
These would appear to be a cyclic clock scrolling incrementally, possibly denoting operation time.
Byte 2 changes from 0x00 pump off to 0x39, 0x38 with pump operation.
Looking at Figure 1, we used a math channel to display positive duty control of the fuel pump (approximately 48%). This byte could be a reference to Target Positive Duty cycle due to the decimal value being 57! A possible correction to the acquired decimal value (57) could be 100 - 57 = 43% target positive duty.
Note that this decimal value changes to 24 when driving the fuel pump at 60 L/H and the measured positive duty cycle using a math channel indicates 22 %.
Byte 3 changes from 0x00 pump off to changing values mainly 1B, 1D & 1C with pump operation.
For this byte, at this stage in time, I don't have a theory on the data it could represent.
Byte 4 changes from 0x00 pump off to 0x10 pump on and remains at 0x10 even though the pump has stopped at packet 8366.
I suspect this refers to fuel pressure!
Byte 5 changes from 7E pump off to changing values mainly 7D with the pump on.
7D represents a decimal value of 125 which I suspect is target fuel delivery (L/H).
Byte 6 changes from 0x00 pump off to 0x78 pump on.
0x78 represents a decimal value of 120 which I suspect is actual fuel delivery which matches the display of the scan tool during the 120 L/H active test.
Note that this decimal value changes to 60 when driving the fuel pump at 60 L/H.
Byte 7 changes from 0x00 pump off to 0x36 pump on.
Regarding Byte 2, this could be the actual fuel pump D duty cycle.
Note that this decimal value changes to 27 when driving the fuel pump at 60 L/H.
In the screenshot below, you can see the decimal values graphed against time, which helps bring each byte to life.
By using a combination of CAN decoding, filtering, graphing, and forced pump operation, we have built a picture of how the data bytes have changed from the Fuel Pump Controller and linked their decimal values to units we can relate to, for example, time, delivery rate and pressure.
This is, by no means, an exact science or 100% accurate, as I may be way off the mark with several assumptions! Without having a .dbc file to describe the CAN ID, byte order, start bit, bit length, formulas and units, so you know what to apply to the decimal data, we are "challenged" to say the least.
I hope this will reveal several tips when attempting to interpret CAN data and provide a foundation for comparison tests with problem vehicles.
Moving on from CAN, the captures above include an accelerometer mounted on the fuel pump's lock ring to qualify physical activity from the pump during operation. I noticed during the active test with the low-delivery rate (60 L/H), that the pump appeared noisy and laboured! This can be seen in the current flow through the fuel pump and the response from the accelerometer (see Figure 8). Notice how the duty control remains fixed throughout the 60 L/H test (positive 22%) confirming that the laboured behavior of the fuel pump is not a result of sporadic Fuel Pump Controller "control".
By using our NVH software, I could capture the data from the accelerometer, convert it to an audio file and listen to the playback! You can read more about listening to accelerometers in this forum post.
Take a listen to the audio from the fuel pump during delivery of 60 L/H.
While this vehicle does not demonstrate any issues surrounding fuel priming or performance at present, it would appear the fuel pump could be towards the end of its service life. I will keep a close eye on fuel pressure as this is my car.
Sven
January 30 2021 - 4:08:09
Amazing analysis and very helpful for learning similar techniques.
Tom Denton
March 21 2020 - 10:23:36
Great work, I love these articles. Now is a good time to study this further too and try it out, using my Pico of course.