PicoScope 7 Automotive
Available for Windows, Mac, and Linux, the next evolution of our diagnostic scope software is now available.
Automotive guided tests
Library of examples on how to perform tests when using PicoScope.

Training
Our collection of training videos, articles, guides and information on training courses.

Waveform library
The Waveform Library is a global database of waveforms uploaded by PicoScope users.

Case studies
Real-life case studies show how the professionals use PicoScope to diagnose vehicle faults.

A to Z of PicoScope
Detailed description of various PicoScope software and hardware features.

Videos
Training resources and demonstrations on PicoScope and the Automotive Diagnostics Kit.

Newsletter
Archive of our monthly Automotive Newsletters.

Documentation
Download manuals, brochures, posters, and training materials.

Reviews and awards
Accolades for the preferred diagnostic tool for service centers and vehicle manufacturers.

| Vehicle details: | Kuboto Mini Digger KX161-3ST (5 tonne) |
| Year: | 2007 |
| Symptom: | Power loss |
| Author: | Ben Martins |
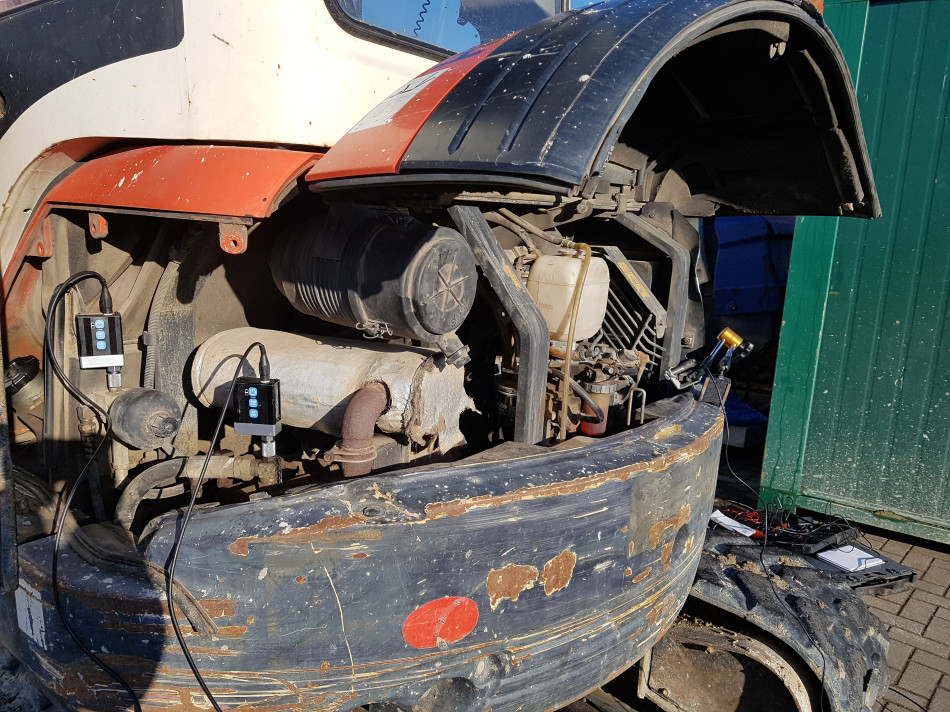
For once, I arrived to take a look at a mini excavator where I didn’t get wet, muddy or covered in dust. Apart from it being a little on the cold side, it was a rather pleasant site visit for a change! This isn’t the most in-depth diagnosis on this machine, but we used PicoScope to record each step of the diagnostic process to verify the fix. Just a quick safety warning here: please don’t use any of what you read here as a substitute for training. Hydraulics is extremely dangerous and carries high risks, much like most of the work us technicians face. If you haven’t had the correct training and someone asks you to look at these machines, please walk away till you have had training. It’s not worth the risk.
The machine I came to look at was relatively old with plenty of hours on it and it had had a bit of a tough life. Needless to say, it’s still going strong although it has now developed a fault. The customer’s complaint regarding this machine was that it was down on digging power.
Having been out to a number of these machines now, I’ve noticed that the operators often are unavailable for the customer interview. This is normally because if the machine can’t be used then they’re either off for the day or they are being used elsewhere. Confirming the fault in these situations is critical to managing the customer's expectations and fixing the fault. With this one, it was pretty straight forward. Normally you can use the digger arm and the blade to raise the machine off the ground with its tracks in the air. This way you can perform additional maintenance on the tracks. With the machine warmed up and at operating temperature and engine speed, we attempted to raise the machine by using the boom and drive the bucket into the ground to lift the front of the machine off the ground. We hardly moved but it sounded like the fluid was passing the relief valve. I firmly believe that it’s difficult to learn from your experiences if you don’t get all your senses involved. Just relying on a scan tool will only get you so far, but being able to listen, smell and see what is going on with any machine will allow you to become a better technician. By being able to draw upon our experiences, and by sharing the knowledge with others, we can all improve our diagnosis of problems in the future.
With the fault confirmed we settled on a test plan. Since it was not a speed-related or a directional problem, we can move both flow and control issues to one side and focus on pressure. As with any hydraulic system, flow makes it go and pressure is resistance to that flow, for example, engine oil pressure. The only reason we create pressure is due to the ‘resistance’ created throughout the galleries and around the crankshaft. All the pump is doing is creating flow. In its basic form, this very principle is underpinning all hydraulic machinery. With this in mind, we looked for the pressure ports to get some measurements.
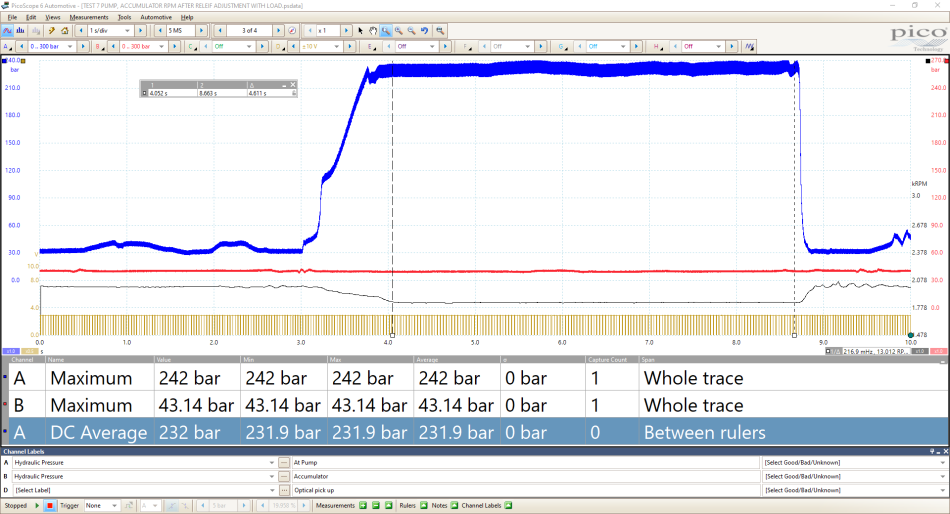
Considering the complexity of some of the hydraulic control systems in the engines, a lot of the smaller machines are fitted with very basic engines. This means that when it comes to acquiring engine speed, we have to look to the optical pickup. By combining it with a math channel, we can graph the engine speed when the hydraulic pressure is put under load. In this instance, we used the math channel: Crank(D, 1) (where 1 is the number of pulses per one rotation of the crankshaft).
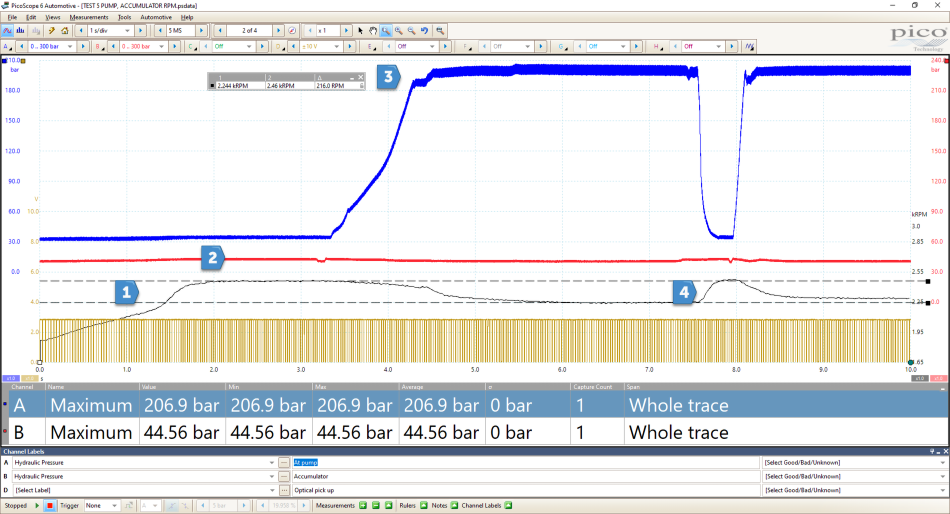
The capture above revealed that the engine speed was pulled down by 216 RPM when the bucket was curled to a deadhead position. This isn’t enough to stall the engine but could be useful in the future if problems start occurring with engine performance. With the system fully loaded, we obtained a peak pressure of 206.9 bar. Please remember that, at this point, this is the peak pressure and when averaged out the result is closer to 200 bar. When you zoom in, however, the fluid is doing something very different.
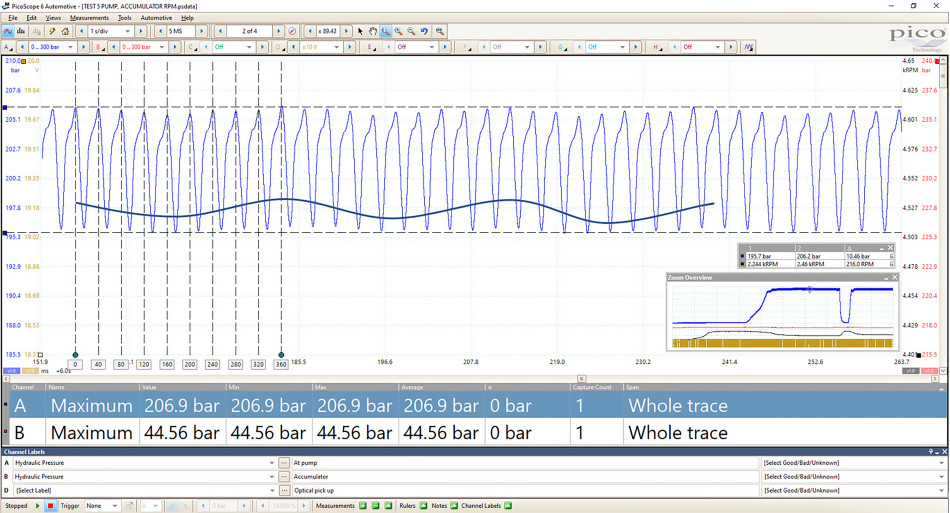
This is the same capture but zoomed in. We can see everything in a lot more detail. This machine uses a variable displacement pump, which in some ways is very similar to an A/C compressor. Several pistons are driving to pull fluid into a chamber and then squeezed back out again to create flow (not pressure remember). This hydraulic pump is no different. Experience tells us that many variables displacement pumps use either 9 or 11 pistons, so we can use the rotation rulers to indicate where each piston would be. I’ve not done a great job at drawing it but there is a wave throughout these pulses providing us with a repeating pattern. This ripple, should it start to get too large, could cause problems later in life with additional noise or performance problems. Being able to see this close to the fluid pulsations means we can see any changes with the pistons should they begin to develop an internal fault. This is extremely useful when trying to identify if a fault is on the hydraulic system or the prime mover.
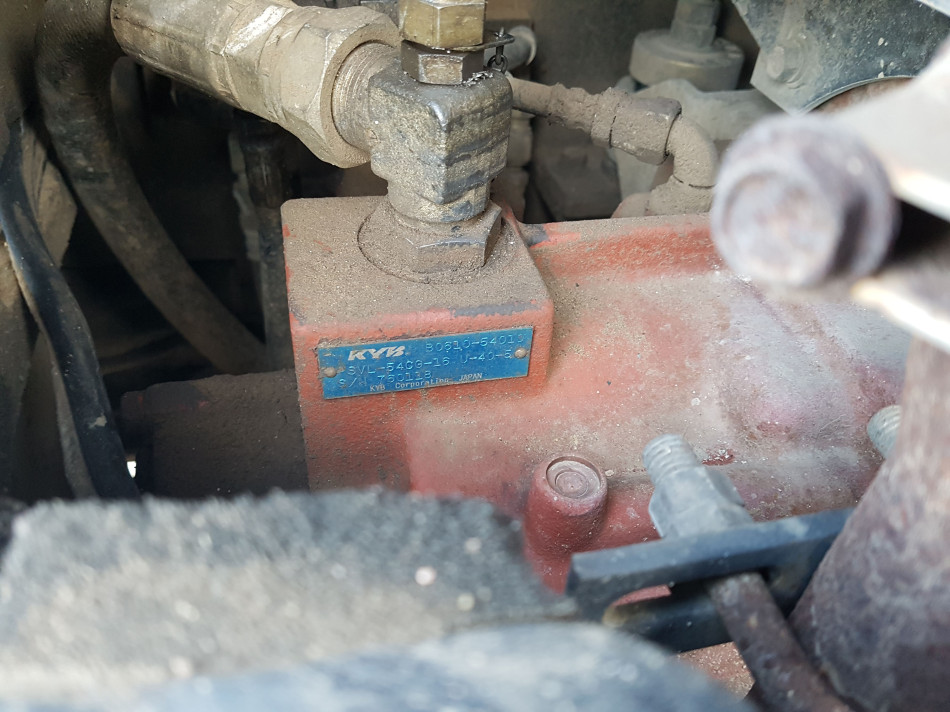
The problem we were faced with now was: how do we know that the achieved pressure reading we have is correct for this machine? I’ve found that trying to find technical information for any machine is difficult when compared to that of the automotive industry. Therefore, you have to explore all the options when it comes to finding information, and sometimes, it’s just as easy to head directly to the OEM for specifications. Using the plate on the pump we looked into KYB’s range for a PSVL-54 and found the information we were looking for.
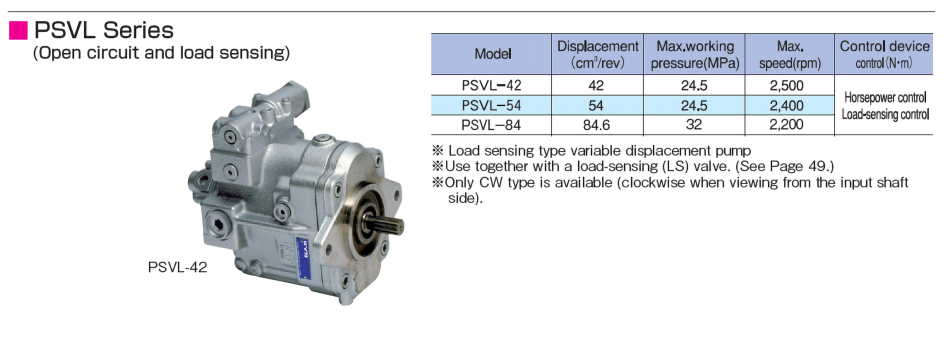
Thankfully, we got all the information we needed to determine that our machine is not getting to the correct working pressure. This would explain why it was down on digging power. If we wanted to check the performance of the pump, we could use these figures to create a theatrical flow rate and by placing a flow meter in the circuit we can carry out and record a PQ test and also calculate the efficiency of the pump using math channels. For more information on this please see our “Maths is Cool” post on our forum.
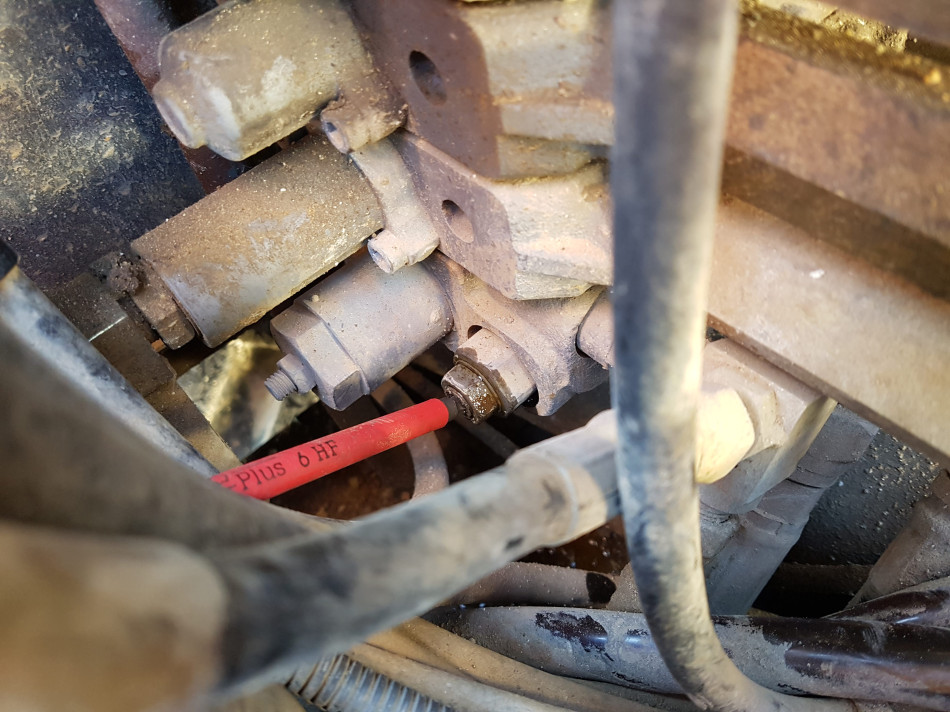
Now onto establishing why the pressure was down. The first thing was to locate a hydraulic schematic of the machine. Yet again a bit of a headache. It is very difficult to carry out any sort of diagnostic testing on a hydraulic system without one of these, but experience can also count. Drawing upon this and training, we could be fairly confident that our starting point had to be locating the relief valve. These devices ensure the safety of the pump by relieving pressure once it reaches a set point. This is normally done by a spring acting on a poppet till the spring force is overcome by the pressure in the system and so opens to direct the fluid back to the tank, similar to that found on a diesel common rail. This is a very basic overview of the relief valve and there is more going on than just this. Appropriate training is required to have the understanding of how these work before you attempt to carry out any repair work.
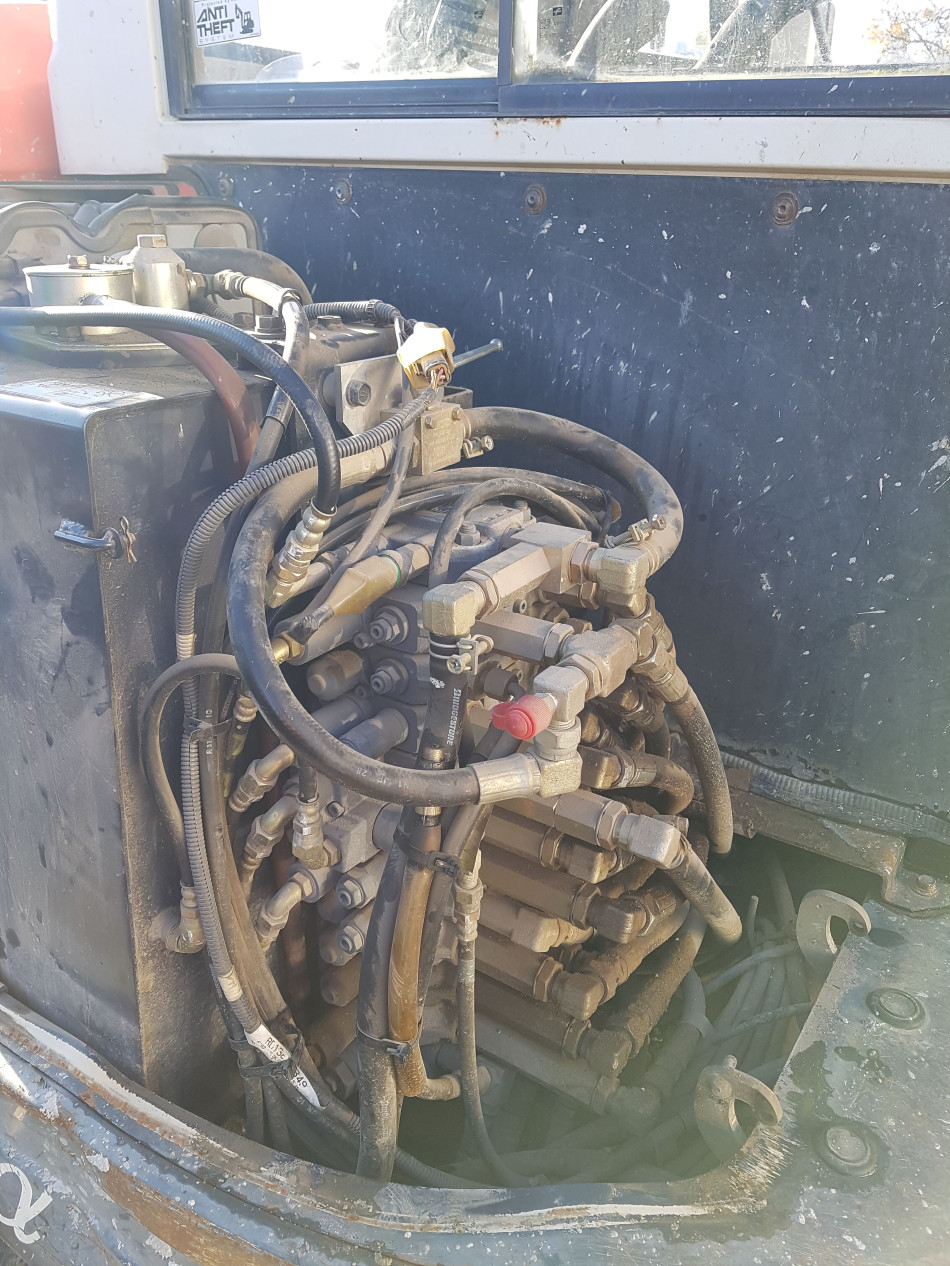
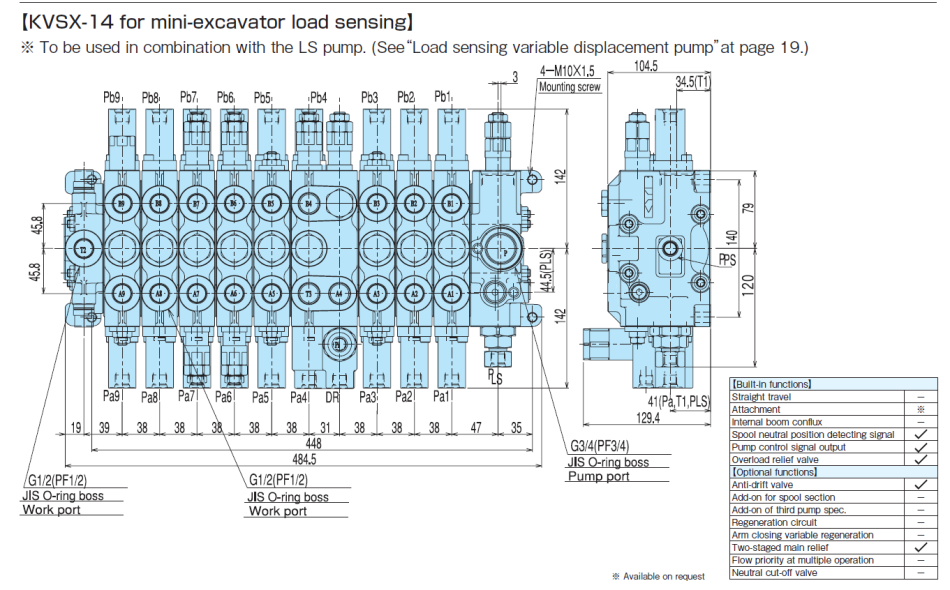
I wasn’t exactly sure where to go next. We turned to the manufacturer’s website hoping for some information and found the following drawing of what appeared to be the same valve block. Looking at the built-in functions table we also spotted that it had a two-stage main relief, which is typical for a load-sense hydraulic system. With this in mind, we started the hunt for a section on the valve block which appeared to have the two-stage relief valve fitted. We found it at the bottom.
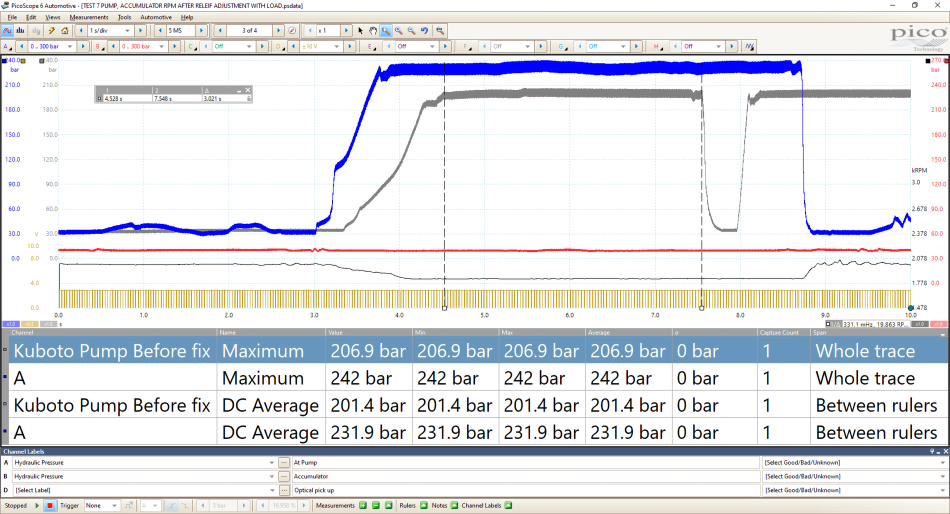
We figured that without the full schematic diagram we could use PicoScope to accurately show us the pressure as we adjusted the relief valve. The internal springs can weaken over time, resulting in the valve opening earlier than normal and so reducing the working pressure. Taking it very slowly we ran the scope, operated the machine to deadhead and adjusted the relief setting until we were seeing a peak max pressure of 242 BAR. This is just a peak not the average but, in some ways, this is fine as we know the max pressure for the pump is 245 BAR. If we were getting too close to this, we would risk putting the pump over its max pressure rating.
We can perform an average measurement using the time rulers at the point on the capture where the machine is at its max pressure. When we reviewed this, we could see that the pressure now was at a much safer level of 232 BAR, protecting both the pump and the machine but increasing the pressure by around 30 BAR and therefore increasing the digging power of the machine.
To verify a fix, we operated the machine again to raise the tracks off the ground, and sure enough, it worked as expected.
For the customer, we had the option to prove that a change has been made by including a reference waveform from the initial capture. Aligning the scales of both the reference and the channel we can see that we have made a change to the pressure reading and, therefore, the machine.
With all this information presented to the customer, it was hard to argue that nothing had changed. For more information on reference waveforms, please see our training section on our website.
I know this wasn’t the most in-depth case study, but hopefully, it has shown that PicoScope shouldn’t just be bought out the box for the difficult challenges we are presented with. It can be used for much more. One thought we discussed while working on this machine was that during routine maintenance you can attach PicoScope to capture the machine’s health at that point in time. Then at each service, you could refer back to the original capture and then compare the results. In a way, it’s a similar idea to predictive maintenance but without the expensive sensors are cloud-based storage. If the machine is regularly serviced then this could prove useful in understanding if things are about to go wrong before they do. All food for thought as always.
Clinton Brett
December 17 2019
From a diesel fuel injection specialist background hydraulic operating systems knowledge is imperative. We run popular diagnostic training courses throughout Australia and new Zealand. Recently we did a collaboration with a very good pico scope trainer here in Australia. We found that combining our training from the mechanical perspective (use your personal senses like you mentioned, sight, sound, smell) with pico is valuable. I’ve become to understand the Pico benefits. We’re looking at doing more of these collabs in the future.
Tom
December 17 2019
What connections did you use.
Was the wps500 in action