PicoScope 7 Automotive
Available for Windows, Mac, and Linux, the next evolution of our diagnostic scope software is now available.
Automotive guided tests
Library of examples on how to perform tests when using PicoScope.

Training
Our collection of training videos, articles, guides and information on training courses.

Waveform library
The Waveform Library is a global database of waveforms uploaded by PicoScope users.

Case studies
Real-life case studies show how the professionals use PicoScope to diagnose vehicle faults.

A to Z of PicoScope
Detailed description of various PicoScope software and hardware features.

Videos
Training resources and demonstrations on PicoScope and the Automotive Diagnostics Kit.

Newsletter
Archive of our monthly Automotive Newsletters.

Documentation
Download manuals, brochures, posters, and training materials.

Reviews and awards
Accolades for the preferred diagnostic tool for service centers and vehicle manufacturers.

| Vehicle details: | Rover 100 |
| Year: | 1996 |
| Symptom: | EBS fault, NVH |
| Author: | Martin Rubenstein |

Pico NVH Starter diagnostic kit (in carry case)
*At Pico we are always looking to improve our products. The tool used in this case study may have been superseded and the product above is our latest version used to diagnose the fault documented in this case study.
For many years I used the Pico resources on the Internet and admired the PicoScope from afar, but couldn’t justify investing in it. I already had a 2-channel monochrome Fluke oscilloscope, which I later upgraded to a 4-channel colour scope. And whilst the graphics quality is poor, the scope can display on my laptop using Flukeview software. Its tools, however, are minimal at best. But the scope did everything I wanted, or so I thought.
That was until I was given a PicoScope 4423 on loan. The power and quality of the PicoScope-software combination bowled me over and exposed the many inadequacies of my Fluke scope for automotive use. It also highlighted how poor the Flukeview desktop-viewing software is. When I then saw that the latest automotive PicoScopes have floating inputs, justifying owning one was easy. My Fluke 190-504 is still an excellent oscilloscope, and I still use it. But for automotive use, and compared to the PicoScope, it’s completely outclassed.
The PicoDiagnostics software that installs alongside the PicoScope 6 Automotive software hadn’t really caught my attention. I even uninstalled the Diagnostics program initially, viewing it as an uninvited gate crasher. Later on, after becoming familiar with PicoScope 6, curiosity about PicoDiagnostics got the better of me, and I was surprised by the range and ingenuity of the diagnostic tests. Sometime later, I was abroad and travelling in a 1991 Opel Kadett, when I was asked, “What’s that squeal?” “What squeal?”, I said. “That, there. What is it?” “That’s not a squeal.” I said, “That’s a vibration, and I’ve no idea what it is, but there’s some kit I can get that will tell us.” That was the excuse I was looking for to add the Pico NVH equipment to my diagnostics hardware.
My 1996 Rover 100 helped me get to grips with NVH. Being pre-OBDII, it's not possible to take a live RPM feed from the diagnostics socket. However, the Pico optical pickup gives a perfect RPM signal using the crankshaft pulley, but I have to place it under the offside wheel arch, which is not ideal, especially if road testing. After a minor modification of a passive filter circuit found on the Internet, it was possible to derive a stable RPM signal from the low-tension side of the coil to feed into Channel D on the PicoScope. Everything was then in place to start running the NVH diagnostics.
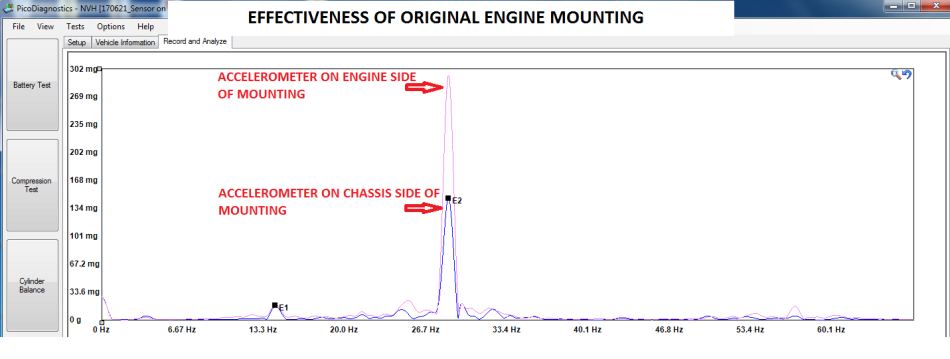
The first thing was to calibrate the 3-axis accelerometer and TA259 interface using the NVH calibration wizard. I do this every time before using the equipment; it removes any concerns over ambient temperatures and the many other possible causes of inconsistency when comparing results. The first test I did was in the passenger compartment with the accelerometer on the inner seat rail. I was a bit surprised by the magnitude of the engine second-order (E2) peak, but, with no experience to fall back on, I asked Steve Smith at Pico for advice. He told me the E2 peak can be high and suggested I test the effectiveness of the engine and gearbox mountings by measuring the vibration on either side of each mounting. When I reported back that the engine mounting was reducing the magnitude of the vibration by 50%, Steve said that was indeed poor.

When the original engine mounting was removed it was clear that the rubber had lost its resilience, so much so that I initially thought the replacement part had been incorrectly made. After 21 years and 107k miles, the rubber was compressed so much that there may well have been a “short circuit” across the mounting, as shown in the photo below, where the old and new engine mountings are shown side by side.
The gearbox mounting did not show a similar compression of the rubber, but the central spigot, bearing the weight of the gearbox-end of the powertrain, had detached from its damping rubber and was free to move about in the centre of the mounting.
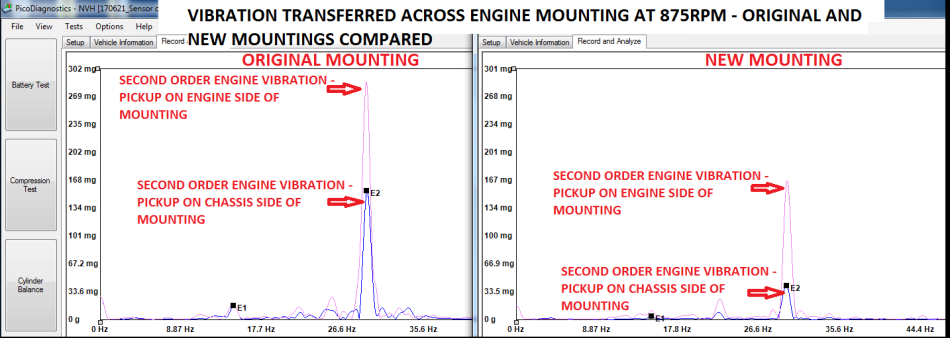
With both mountings replaced, it was time to run the NVH tests again to see what difference the new mountings made. Using Reference Waveforms, the old waveform was displayed together with the new waveform for easy comparison. Comparing the effectiveness of the original and new engine mountings at 875 RPM, for example, shows that not only did the new mounting reduce the level of vibration on the engine side of the mounting, but the engine mounting itself reduced the transmitted vibration to a much greater degree. (Notice both Y-axes are the same scale, and the engine vibration frequencies are identical because care was taken to keep the idle speed constant.)
When running the before-and-after NVH analyses, great care had to be taken to make sure the engine temperatures were the same otherwise the idling speeds would differ; a small change in engine speed can affect the magnitude of the vibration (as well as its frequency, of course) and would have invalidated a fair comparison of the 2 sets of results. Ideally, such tests should be done when the engine has reached its normal operating temperature and the idling speed has fully settled.

After replacing the two mountings, the reduction in the first-order and second-order vibrations transmitted through to the passenger compartment was significant, as the image above shows. The failure mode of engine mountings is generally one of imperceptible deterioration over many years rather than a sudden failure. NVH analysis on the Rover provided hard, objective evidence that the engine and gearbox mountings on this car were long overdue being replaced. The car now feels more comfortable at idle, and the NVH data shows that this is not just wishful thinking to justify the cost and effort of fitting new parts; the improvements can be quantified. Furthermore, had the car been OBDII compliant, a Mongoose lead could have been used to input engine speed data via a USB port, thereby freeing Channel D for a microphone (via an interface). An objective assessment of the before-and-after sound levels inside the car could then also have been made at the same time as the vibration analysis.
These NVH diagnostic results could also provide a valuable reference against which future NVH test results could be compared, removing all subjective assessment and guesswork - and possibly saving unnecessary dismantling for a visual inspection of the mountings.
Jeff Frandsen
May 29 2019
I have found that using a (low) current clamp around the ignition coil primary lead provides a reliable RPM signal (which can be scaled in the software). Tried this technique in an old 1300 VW Golf Mk 1 and it works well and didn’t need any low pass filtering.


