PicoScope 7 Automotive
Available for Windows, Mac, and Linux, the next evolution of our diagnostic scope software is now available.
Automotive guided tests
Library of examples on how to perform tests when using PicoScope.

Training
Our collection of training videos, articles, guides and information on training courses.

Waveform library
The Waveform Library is a global database of waveforms uploaded by PicoScope users.

Case studies
Real-life case studies show how the professionals use PicoScope to diagnose vehicle faults.

A to Z of PicoScope
Detailed description of various PicoScope software and hardware features.

Videos
Training resources and demonstrations on PicoScope and the Automotive Diagnostics Kit.

Newsletter
Archive of our monthly Automotive Newsletters.

Documentation
Download manuals, brochures, posters, and training materials.

Reviews and awards
Accolades for the preferred diagnostic tool for service centers and vehicle manufacturers.

| Vehicle details: | Toyota Celica |
| Engine code: | 2ZZGE |
| Year: | 2001 |
| Symptom: | P0172, Poor acceleration, Poor idle |
| Author: | Pico | Steve Smith |
The case study below demonstrates how PicoScope fits within the diagnostic jigsaw when resolving seemingly complex issues.
The analogy of a jigsaw fits well if we look at the essential pieces required for a successful diagnosis.
The vehicle in question is a 2001 Toyota Celica 1.8 190 PS utilising variable valve timing and lift.
The complaint from the customer was poor idling, heavy fuel consumption, lack of power, periodic cutting out on over run and the all-important engine warning light was illuminated.
As always the customer interview is vital, and in this case revealed that extensive engine work had been carried out including a cylinder head replacement due to severe overheating.
At this point it is very easy to jump to conclusions and assume "doom and gloom" when a customer arrives having experienced numerous attempted repairs after a major engine overhaul, however, by maintaining a methodical approach throughout the diagnostic procedure we can present our customer with not just a bill, but a working vehicle and the evidence and data trail that supports the necessary rectification.
A basic inspection revealed the tell-tale signs of intrusion about the engine to include, a new cylinder head, VVT oil control valve, coolant temperature sensor, catalyst, pre-catalyst O2 sensor accompanied with a punctured and misrouted wiring harness that resembled a pin cushion! A brief road test confirmed the customer's complaint but also revealed the engine to sound fine with no knocks or rattles, or smoke from the exhaust and both coolant temperature and pressure to be correct.
Note: The exhaust fumes did emit the sulphur odour associated with over fuelling or a catalyst working overtime! (it is essential to establish the engine condition before spending the customer's money).
To begin, the scan tool (our first piece of the diagnostic jigsaw) was connected and fault code P0172 recovered with the relevant freeze frame data.
P0172 refers to "System too Rich" whilst the freeze frame data confirmed fuel trim figures attempting to compensate for the "Rich" fuel condition at idle (Long FT -26.59% Short FT -10.97%)
The negative fuel trim value indicates the PCM has been progressively reducing the amount of fuel injected as a result of information returned from the O2 sensor (O2 sensors report a rich condition, the PCM reduces injector duration until the O2 sensor reports a lean condition).
This form of closed loop fuelling will continue for as long as the total of the long and short fuel trim values remain within +-25%.
In the case below our total Fuel trim values -26.59% + -10.97% = -37.56% and so P0172 is stored and indicted to the driver via the MIL.
Code P0172 freeze frame data indicates error occurred at idle speed:
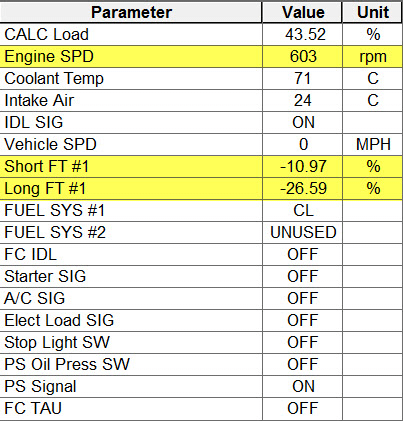
Here is where the scan tools come into their own as both the fault code and freeze frame data provide the all-important reasons why the MIL is illuminated and a historical snapshot of events that were present when the PCM recorded the fault code P0172.
So where do we start with an engine running too rich?
The description of rich here would be insufficient air or excessive fuel and so keeping it as non-intrusive as possible, the intake, exhaust system, evaporative loss and engine breather valve were inspected for leakage and restrictions that could influence fuelling or breathing, all were OK.
A gas analyser check confirmed Hydrocarbons to be high on arrival at 305 PPM, falling to 17 PPM at 2500 rpm and initially remaining low on return to idle, but increasing during the unstable idling condition.
Here we know that idle fuelling is incorrect (producing 305 PPM HC) and fast idle fuelling (off load) to be correct as the catalyst is performing as intended.
O2 sensor signal and fuel delivery pressure at idle were both next for scrutiny as either have the potential to influence fuelling to produce a rich condition.
Fuel pressure was fine at 46 PSI, however the O2 sensor signal was stuck rich at idle speed but switching correctly above 2000 rpm.
Let's evaluate what we know and form the all-important action plan:
Here is where the second and third pieces of diagnostic jigsaw join to form our action plan. Technical information and Experience gained as a direct result of training allow us to evaluate all that we know.
The engine is rich at idle but flat and lacking in power when accelerating (remember, "System to rich" equals lack of air or too much fuel).
A decision has to be made here of which system to pursue and the major deciding factor is ease of access accompanied with the time involved to evaluate.
Based on all the above and experience gained, the air intake metering has to be the obvious choice of where to deploy the final piece of the diagnostic jigsaw... PicoScope.
Looking at the intake tract the scope was connected to assess the relationship between the throttle position, MAF meter response and output and O2 sensor signal.

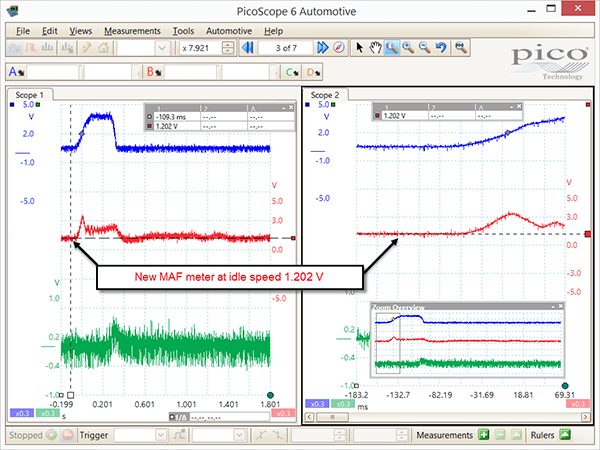
At last a breakthrough, the Hot Wire MAF meter response and output was nothing short of dismal given the difference between idle speed MAF voltage and Wide Open Throttle MAF voltage was 1.31 V! This sits well with the symptom of poor performance from rest and could not be the result of a mechanical condition as the engine could achieve high RPM on road-test (just delayed). However, how does this fault within the MAF sensor generate a code of P0172 (system to rich) when we clearly have a system too lean under acceleration? Generally speaking a MAF meter with this style engine will range from 1.2 V at idle to approximately 4 V at WOT (see below new MAF installed)..

Here we can clearly see an excellent response time of 56 ms for the MAF meter to WOT accompanied with an initial maximum output of 4 V. The O2 sensor now responds to the change in fuelling as enrichment takes place during WOT unlike the original capture.
A point to note here when installing a new MAF meter to replace a faulty unit:
The engine management fuelling will have adapted to the feedback and response time of the original MAF meter and so PCM fuelling adaptions will need to be reset or, the vehicle driven over a specified period of time to allow for the PCM to adapt progressively. I have seen MAF meters installed momentarily during substitute diagnosis only to find no improvement because the PCM has not been allowed or forced to adapt. The faulty MAF meter is then reinstalled and the incorrect diagnosis continues (Technical information and experience as a result of training come into play here)!
To recap, the new MAF meter has resolved all the symptoms mentioned and a re-check of the scan tool data list confirmed the fuel trims to be levelling out and O2 sensor to now be switching at idle (previously stuck rich). These results indicate the MAF to be faulty 3 fold, over-reading at idle, under reading during acceleration and poor response to WOT.
It was the over-reading at idle that got me thinking as I had not seen this fault before with a MAF meter, only under reading and poor response (often generating P0171 "system too lean").
Closer inspection of the faulty MAF meter waveform revealed an idle speed voltage of 1.775 V where the replacement MAF sensor was 1.418 V (faulty MAF meter reading 20% higher for the same engine speed).
As a result of this revelation, further acquisitions of the new MAF meter were taken and the average idle speed values recorded during repeated 'idle -WOT - idle tests'. These were found to be even lower at 1.202 V, meaning our faulty MAF meter was actually reading 32 % higher at the same given idle speed!
Additional Hotwire MAF meter information
By design, any contamination of the exposed sensing element will alter the operation characteristics (cooling) of the hotwire assembly. Therefore measuring the MAF sensor signal wire with the ignition on and engine off will provide an indication of contamination level where high contamination level will result in a high output voltage. Refer to the relevant technical information for key on, engine off values.
This is where we return to the scan tool and the live data captures taken before and after replacement of the MAF meter to confirm the findings of the scope. Remember an increase in airflow results in an increase in the output voltage of the MAF sensor:
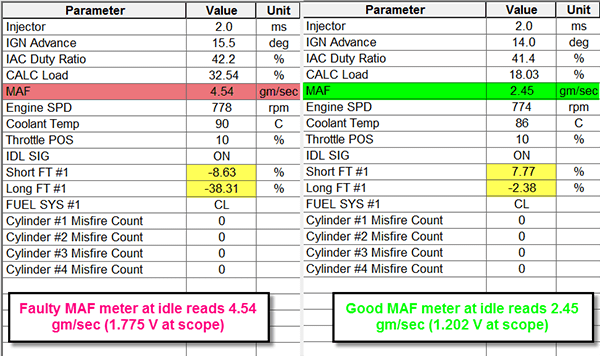
The scan tool live data capture has the faulty MAF meter reading 33% higher than the replacement but keep in mind:
Our PicoScope is purely looking at the real-time output voltage without any manipulation. When all is said and done, both tools are reporting the same condition, the over voltage output from the MAF meter (at idle) is responsible for the incorrect over fuelling condition at idle speed.
Calculating theoretical MAF values
As a basic indication of airflow, using the formula below we can estimate MAF for any normally aspirated engine speed (assuming a WOT):
(RPM X ENG CAPACITY in LITRES) / (60 X 2 INTAKE STROKES PER REVOLUTION)
E.g. our normally aspirated 1.8 litre, 4 cylinder, 4 stroke engine running at 3000 rpm would consume:
3000 RPM / 60 = 50 Rev per second (Hz)
For each engine revolution of our 4 cylinder engine we have 2 x intake strokes
Therefore 50 rev per second / 2 = 25 intake strokes per second
25 X 1.8 litre = 45 litres per second
Note: Air mass is approximately 1 gram per litre at sea level (pressure and temperature dependent).
Therefore 45 litres per second is approximately 45 grams per second (45 gm/sec).
Technical information allows formulas as those above to be implemented during diagnosis to evaluate test results, presenting a real advantage to those who invest in the jigsaw.
We can use the formula above to create a Maths Channel that can be applied to the crankshaft signal of any normally aspirated 4 stroke engine in order to display the theoretical MAF value during our WOT test (remember if we know the engine speed, number of cylinders and the engine capacity we can calculate airflow).
Now we can cross reference this value against the scan tool data list to confirm the integrity of the MAF meter and ultimately the ability of the engine to breathe. Do not be too alarmed if the maths channel value does not match the scan tool MAF value under WOT at a given engine speed as we are calculating the theoretical value only. However, the scan tool data list should display a value marginally close to the theoretical value and not excessively over or under this value.
So how do create a maths channel?
Below we describe how to create two maths channels, one to calculate RPM and the other to calculate MAF. Only the MAF formula is relevant for this case study but including the RPM formula for this vehicle enables the technician to see both RPM and MAF (Maths Channels are applied after capture when reviewing the waveform).
Calculating RPM
The Celica Crankshaft pick up ring has 36 teeth with 2 missing as a TDC reference. Whilst in reality we have 34 teeth, we must include the missing teeth in our formula for accurate RPM results.
To explain further how the maths channel can display RPM we need to look at the theory below:
PicoScope measures the frequency of 36 teeth of the crankshaft sensor pick up (1 crankshaft revolution) and multiplies this value by 60 (seconds) to obtain RPM :
36 Teeth of our crankshaft pick up are equal to = Hz x 60
The maths channel formula for RPM is written as follows: 60/36*freq(A)
With your captured waveform on screen select Tools>Maths Channels and then Create. Click on Advanced and type "60/36x" in the formula box, then click on the freq button. When "freq( )" appears in the formula box, put your cursor in-between the two brackets "( )" and type "A", the whole formula should look like 60/36*freq(A).
Click Next, choose any colour you prefer for your RPM maths channel, in the Units section type "Engine Speed" in the Long name box and "RPM" in the Short name box. In the Range select box it is best to set a manual override for the actual range you require (in the example below I have selected 0 RPM to 7500 RPM) and finally click Finish. Click the box next to your created maths channel to enable it and click OK. A new (maths) channel will appear and will plot the RPM of the channel you have requested.
Calculating MAF
The maths channel formula for MAF is written as follows:
60/36*freq(A)/60/2*1.8
PicoScope calculates the RPM (as above) but now incorporates the additional formula to account for 2 intake strokes and a 1.8 litre engine
Once again select Tools>Maths Channels and then Create. Click on Advanced and type the exact formula as above for RPM 60/36*freq(A)Â but now add /60/2*1.8.
The whole formula looks like 60/36*freq(A)/60/2*1.8
Click Next, choose any colour you prefer for your MAF maths channel, in the units section type "Airflow" in the Long name box and "gm/sec" in the Short name box. In the Range select box it is best to set a manual override for the actual range you require (in the example below I have selected 0 to 130 gm/sec) and finally click Finish. . Click the box next to your created maths channel to enable it and click OK. A new (maths) channel will appear and will plot the MAF of the channel you have requested.
Below we have the waveforms from our donor Celica looking at Crankshaft signal, Throttle Position, and good MAF. We now also have 2 maths channels indicating a Max 7003 RPM and a Max 106.2 gm/sec MAF. The peak values of the maths channels reveal the measured values of interest. The regular downward spikes are characteristic of the missing teeth from the crankshaft sensor pick up ring.

Below we have the serial data from our scan tool displaying Engine SPD, Throttle Position and MAF as a line graph. Note the refresh rate (update speed) is poor with only 3 parameters selected. Comparing the serial data results to the scope we have a Max engine speed of 7021 RPM with a Max MAF of 111.85 gm/sec.

So here we conclude the case study and I hope highlight the relationship between PicoScope and Scan tool.
When looking how the customers issue was resolved, the pattern is a repetitive one where numerous parts are installed after multiple garage visits yet the solution came from an individual who has invested in the applicable Scan tool, Technical information, Training (gaining experience/knowledge) and applied the essential part of the diagnostic jigsaw...PicoScope.
Jeff
March 19 2016
For those that are questioning the way he calculated the MAF. I believe he was trying to stay in the same order as the math channel.
Alex Wright
February 23 2015
Hi Steve, great post, very informative. There is something very confusing about your MAF caluclation though
“For each engine revolution of our 4 cylinder engine we have 2 x intake strokes” here you refer to the individual intake stroke of each piston.
“25 X 1.8 litre = 45 litres per second” now in this equation you refer to the 25 strokes as being a complete 4 stroke cyle, ie 4 individual cylinder strokes.
Would it not be less confusing if you worded it something like this
“It takes 2 revolutions of the engine to complete the four stroke cylce
50revoultions per second = (50/2) = 25 four stroke cyles per second
25 * 1.8litres = 45 grams per second”
Anonymous
February 13 2015
I believe there may be 2 miscalculations in the MAF formula.—-First is the weight of air is 1.286 grams per liter as nitrogen alone weighs 1 gram per liter almost exactly and the remaining oxygen weighs .286 grams (air is 80% N and 20% O)
Almost 30% more.
-Second is where we calculate 25 intake strokes by 1.8. The entire 4 cylinder engine is 1.8 resulting in each cylinder a therefore each intake stroke to be only .450 liters.
25x.450 = 11.25 liters
11.25 liters x 1.286 = 14.47 grams
Leo
February 10 2015
Great article and why it’s so important to have a scope at your disposal.. Could we not have used a volumetric efficiency calculator to see how the MAF is performing.. Come to think of it.. engine at high rpm and the MAF working well maybe the volumetric efficiency calculator wasn’t the best way in this instance.
Anonymous
February 04 2015
Really informative article that is much appreciated. I don’t understand why (Therefore 50 rev per second / 2 = 25 intake strokes per second
25 X 1.8 litre = 45 litres per second) if there are 2 intake strokes per revolution wouldn’t you mulitiply 2 rather than divide? What am I missing?
Thanks so much, Gary
Stuart G
February 02 2015
Great writeup, and a clear example of using non intrustive tooling to find the fault.
My only question is why wasn’t the MAF reading monitored more closely on the scan tool? I appreiate you stated that it was flucuating during the test, but using a graph plotter (like in your last screengrab) whould show the clear excess of air, as you had already discovered the issue was either air or fuel related.
Great study though and explains well how to approach Fuel trim issues, a grey area for a lot of people!
ps. I have taken note of your Maths Channel tutorial, very good!!
Anonymous
January 31 2015
The CLV of 43.52% at idle is also a strong indication of an over-reading MAF.
Michael Ball
January 31 2015
Thank you for a very interesting case study.
I think I would have worked out the mass airflow differently, “E.g. our normally aspirated 1.8 litre, 4 cylinder, 4 stroke engine running at 3000 rpm would consume:
3000 RPM / 60 = 50 Rev per second (Hz)
For each engine revolution of our 4 cylinder engine we have 2 x intake strokes
Therefore 50 rev per second / 2 = 25 intake strokes per second”
Surely, in a four cylinder, 4 stroke eng there are 2 intake strokes per revolution therefore 50 rev’ per sec * 2 = 100 intake strokes per sec and each intake stroke is worth .45 lt (i.e. capacity of one intake stroke assuming 100% volumetric efficiency). 100 intake strokes * .45 lt = 45 lts. Arrives at correct answer but by a curious process. Perhaps I am oversimplifying it.
The study certainly high lights the need for the application of various pieces of diagnostic equipment and approaches, keeping an open mind and gathering as much detailed information as is required to form an accurate diagnosis.
Best regards
Mike Ball
eric
January 30 2015
Noticed the calculated engine load dropped almost in half after replacing MAF. Seemed awful high with bad MAF in original scan data. Nice case study.
Anonymous
January 30 2015
simply brilliant
Allan
January 30 2015
This is real awesome info. You do need experience to resolve problems as such, and also your Picoscope at your side. Great stuff man!!!


