PicoScope 7 Automotive
Available for Windows, Mac, and Linux, the next evolution of our diagnostic scope software is now available.
Automotive guided tests
Library of examples on how to perform tests when using PicoScope.

Training
Our collection of training videos, articles, guides and information on training courses.

Waveform library
The Waveform Library is a global database of waveforms uploaded by PicoScope users.

Case studies
Real-life case studies show how the professionals use PicoScope to diagnose vehicle faults.

A to Z of PicoScope
Detailed description of various PicoScope software and hardware features.

Videos
Training resources and demonstrations on PicoScope and the Automotive Diagnostics Kit.

Newsletter
Archive of our monthly Automotive Newsletters.

Documentation
Download manuals, brochures, posters, and training materials.

Reviews and awards
Accolades for the preferred diagnostic tool for service centers and vehicle manufacturers.


WPS500X Pressure Transducer

WPS500X Adaptor Kit A (Requires TA212)

WPS500X Adaptor kit B (Requires TA212)

WPS500X Maxi Kit (with carry case)
*At Pico we are always looking to improve our products. The tools used in this guided test may have been superseded and the products above are our latest versions used to diagnose the fault documented in this case study.
The purpose of this test is to confirm that the turbocharger will produce a positive charge pressure during throttle opening.
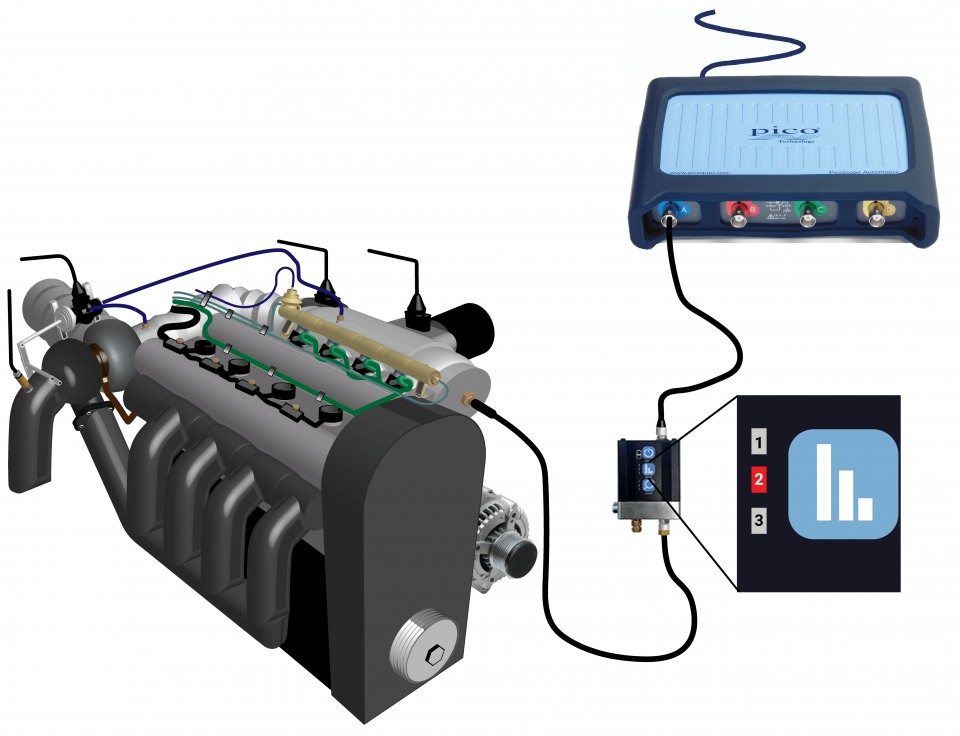
View connection guidance notes.


Channel A shows the intake manifold vacuum/pressure during the various stages of the test.
The green line (at marker 3) denotes atmospheric pressure 0 mbar.
The black ruler (at marker 1) denotes idle intake vacuum, approximately -560 mbar
The orange arrow (at marker 4) denotes the initial delay from the start point of WOT to the commencement of positive pressure (at marker 5) building inside the intake manifold, referred to as Turbo lag. The example waveform shows that the test vehicle measures to approximately 600 ms.
The orange arrow (at marker 6) denotes the time taken for the intake manifold pressure to build to its peak of +560 mbar (at marker 7), from the initial increase at marker 5.
By adding the time indicated by the orange arrows at markers 4 and 6, you can calculate the total time taken to achieve maximum manifold pressure (boost pressure) from the initial WOT at marker 2. (Approximately 1.1 seconds on our test vehicle.)
The purple arrow (at marker 7) denotes the maximum positive manifold pressure (above atmospheric) produced by the turbocharger. The boost pressure.
The blue line (at marker 9) denotes the maximum manifold vacuum, approximately -820 mbar.
Typical values (when the engine is at correct operating temperature).
Refer to vehicle technical data for specific test conditions and results.
When idle speed stabilization has been executed by the engine management and all loads applied to the engine have settled, the idle speed manifold vacuum should remain reasonably stable on this time base.
For more accurate analysis at idle speed refer to the Pressure Sensors > WPS500X Pressure Transducer > Intake Manifold Pressure-Idle Speed pre-set on the Automotive menu.
Applying WOT, with the engine at the correct operating temperature, should result in an instant decrease of the manifold vacuum, reverting to the atmospheric pressure (0 mbar) indicated by the green line at marker 3.
There will be no restriction inside the intake manifold while the throttle is held open. As a result, the intake manifold will remain equal to atmospheric pressure until the turbocharger speed increases sufficiently to generate a positive pressure (boost pressure at marker 5).
At approximately 360 degrees of crankshaft rotation, you can see the commencement of the intake pocket dropping below 0 bar indicating the cylinder pressure to now fall into a vacuum. This indicates adequate sealing of the exhaust valve that will now close as the piston descends the cylinder during the intake stroke. Valve timing, the integrity of the air intake, piston compression rings and cylinder face, can also be confirmed by looking at intake pocket. The depth of the intake pocket (the vacuum level) can be measured with the signal ruler (marker 5) and the value displayed in the ruler legend (marker 4) at -698.6 mbar.
From the instant the throttle is held wide open, an inevitable delay will be experienced before the commencement of positive pressure building inside the intake manifold. This is referred to as Turbo lag. The example waveform shows that the test vehicle measures to approximately 600 ms. (indicated by arrow with marker 4).
As the engine speed continues to increase, the speed of the turbocharger’s turbine and compressor shaft will increase to a point where a positive pressure is generated inside the intake manifold. This initial increase in manifold pressure (above atmospheric) is indicated by marker 5.
The time for the intake manifold pressure to increase from the commencement of boost pressure at marker 5 to the maximum boost pressure at marker 7, is indicated by the arrow by marker 6. In the example waveform, the time was approximately 470 ms
The continued increase in the turbocharger’s turbine and compressor shaft speed during the WOT stage results in a rapid increase in manifold pressure to the maximum boost pressure recorded at marker 7 (highlighted with the purple arrow). Please be aware that the value recorded here must only be used as an indication of turbocharger activity, (confirming rotation of the turbine and compressor shaft) and not a definitive guide to the efficiency of the turbocharger. Various manufacturers will limit the turbocharger maximum boost values when the vehicle is stationary. This highlights the need to carry out a similar test under road test conditions. Make sure that the maximum boost pressure does not exceed the manufacturer’s stated value as this could indicate a sticking turbocharger waste gate/vane control mechanism or failure within the maximum boost control circuit.
When you release the throttle pedal, both the engine speed and the turbocharger’s turbine and compressor shaft speed will decrease, resulting in a fall in boost pressure to below atmospheric pressure, and returning to a vacuum. Be aware that the turbocharger speed and engine speed will fall at differing rates resulting in a progressive return into a vacuum as opposed to a rapid return with non-turbocharged engines.
Given the engine speed is high but falling after the WOT test (throttle now closed) the intake manifold vacuum continues to rise above the stable idle speed level (at marker 1) to form the intake pocket. Here you can further confirm the mechanical efficiency of the engine and the integrity of the intake system. A small intake pocket could indicate a mechanical defect or intake leak. For more accurate analysis of the intake pocket, refer to Pressure Sensors > WPS500X Pressure Transducer > Intake Manifold Pressure-WOT Snap Test pre-set on the Automotive menu.
GT787
Disclaimer
This help topic is subject to changes without notification. The information within is carefully checked and considered to be correct. This information is an example of our investigations and findings and is not a definitive procedure.
Pico Technology accepts no responsibility for inaccuracies. Each vehicle may be different and require unique test
settings.
We know that our PicoScope users are clever and creative and we’d love to receive your ideas for improvement on this test. Click the Add comment button to leave your feedback.


