PicoScope 7 Automotive
Available for Windows, Mac, and Linux, the next evolution of our diagnostic scope software is now available.
Automotive guided tests
Library of examples on how to perform tests when using PicoScope.

Training
Our collection of training videos, articles, guides and information on training courses.

Waveform library
The Waveform Library is a global database of waveforms uploaded by PicoScope users.

Case studies
Real-life case studies show how the professionals use PicoScope to diagnose vehicle faults.

A to Z of PicoScope
Detailed description of various PicoScope software and hardware features.

Videos
Training resources and demonstrations on PicoScope and the Automotive Diagnostics Kit.

Newsletter
Archive of our monthly Automotive Newsletters.

Documentation
Download manuals, brochures, posters, and training materials.

Reviews and awards
Accolades for the preferred diagnostic tool for service centers and vehicle manufacturers.

| Vehicle details: | Toyota GT86 – ZN6 |
| Engine code: | FA20 (Subaru Flat-four) |
| Year: | 2012 |
| Symptom: | Cabin vibrations, Non-starter with cranking |
| Author: | Steve Smith |

WPS500X Pressure Transducer
*At Pico we are always looking to improve our products. The tool used in this case study may have been superseded and the product above is our latest version used to diagnose the fault documented in this case study.
The engine is a non-start after a major engine overhaul.
Compressions and valve timing have been checked and are correct.
The initial cranking of the engine confirmed a non-start condition accompanied with an odd intake and exhaust note. On occasions, the engine would attempt to fire during cranking but would not run.
The customer interview revealed that the vehicle had suffered from a major engine failure due to oil starvation. As a direct result, the cylinder block, crankshaft, pistons, oil pump, oil strainer and associated consumables had all been replaced (in effect a short engine).
The basic inspection highlighted all the typical visible markings of such a major repair but nothing to suggest any errors with ground connections, harness routing or auxiliary component fitment.
I broke away from tradition here, as I would normally carry out a scan of the PCM while monitoring live data throughout. However, given the history of the vehicle and the odd cranking sound via the intake/exhaust, coupled with the fact that the battery had been disconnected, charged, boosted and discharged, my experience told me that a relative compression test with PicoDiagnostics was a valid first move.
This is not me saying that scan data would not have yielded results, but it was more a case of using my experience to choose the right tool at the right time to bring about a valid diagnosis.
The Toyota Hilux case study here shows an interesting phenomenon to note with engine management systems during cranking:
“The starting phase of an engine is subjected to a “Mask period” during cranking where the PCM switches to a basic fuel map whilst the starter signal (STA) is set to ON. Basically, it looks at cam and crank for synchronization using a counting technique.
Based on the correct sync and number of teeth everything else can be ignored from a monitoring point of view. It’s almost like the PCM closes its eyes during cranking (other than counting), and hopes for the best! Once started and set conditions are met (such as engine speed above a threshold level and STA terminal to 0 V), the system can then switch to the relevant running map, go to full monitoring of various sensors/actuators and so generate any relevant codes.”
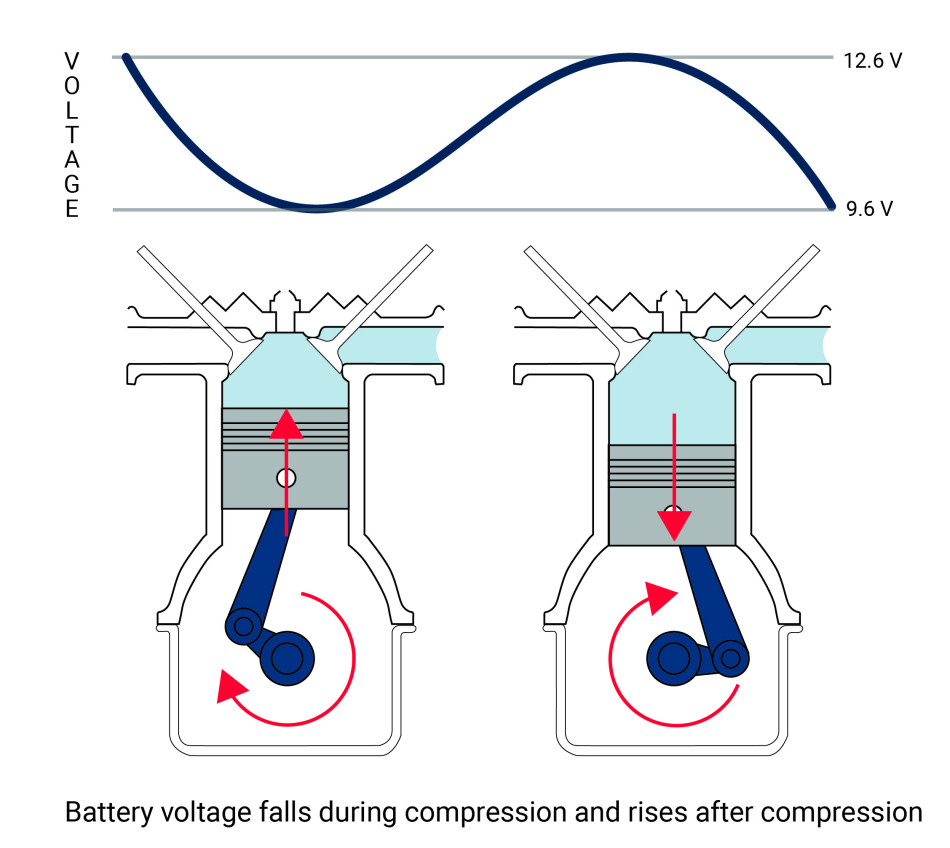
The Relative Compression test in PicoDiagnostics is very simple. It uses the effects on battery voltage during cranking to compare the cylinder efficiency. With a single test lead connected across the vehicle battery and the number of cylinders entered into the software, the engine is cranked while fueling is prohibited. PicoDiagnostics records the fall in the battery voltage during cranking, which is directly proportional to the starter motor’s effort during each compression stroke.
The images below illustrate the PicoScope connection and characteristic voltage behavior during cranking.
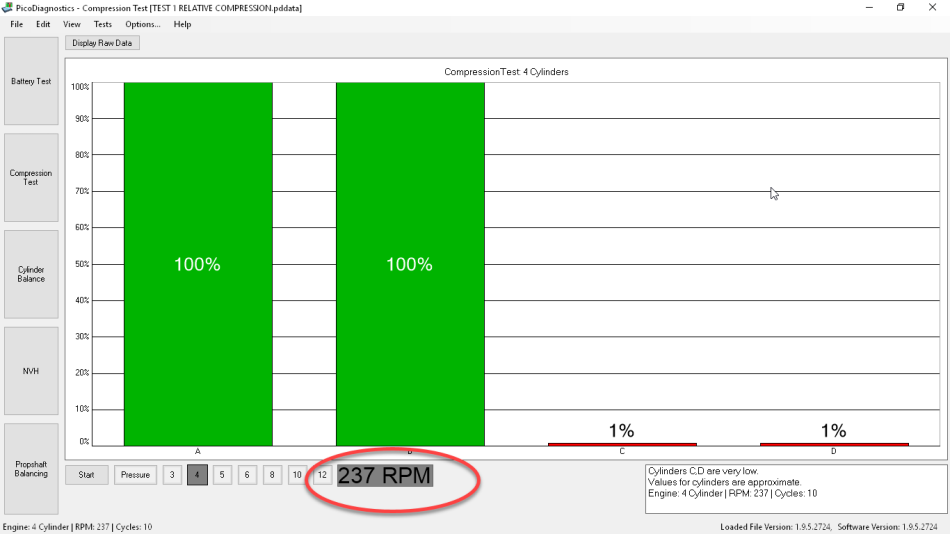
The results from the relative compression test supported my selection of tool and could also confirm that this was not a rapid repair. Two cylinders were obviously very low on compression!
Interestingly, the recorded cranking speed of the engine (237 rpm) suggested that the compression values were normal. You would expect the engine to rotate faster due to the reduced load on the starter motor when you have two missing compressions.
So how is cranking speed obtained in the relative compression test, given the only connection to the vehicle is across the battery terminals to measure the battery voltage?
As we have entered the number of cylinders into the software (four) the software knows that two consecutive volt drop events equate to one crankshaft revolution (two compression events for every crankshaft revolution). The frequency of this volt drop (battery voltage signal) is then multiplied by 60 to calculate the RPM.
In the PicoDiagnostics software, the user can split the display into bar graph results combined with the raw battery voltage signal by clicking on the Display Raw Data button in the top left corner. The keen-eyed amongst you may have spotted that this most certainly is a strange relative compression waveform and not the characteristic sawtooth pattern we would obtain from an efficient engine.
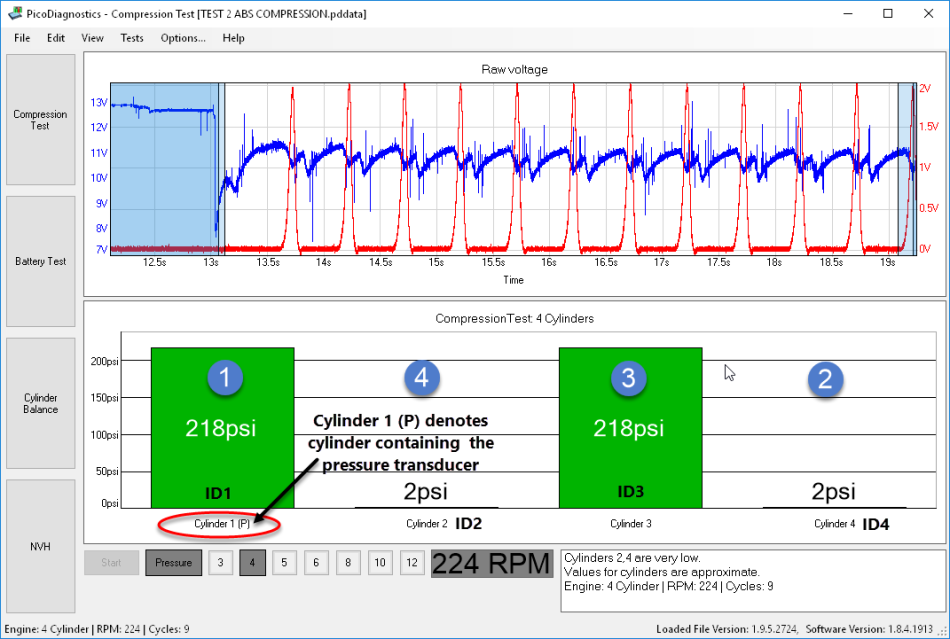
To bring about some clarity (or so I thought), I performed an Absolute compression test in PicoDiagnostics to obtain the cylinder pressure values during cranking and hopefully identify the offending cylinders. Absolute compression can be measured with a pressure transducer in cylinder 1 while you monitor the voltage drop associated with each subsequent compression event.
The software will measure the compression pressure and the voltage drop for cylinder 1 (during compression). By using a proprietary algorithm, the software will utilize the voltage drop for the remaining cylinders (during compression) to evaluate the cylinder pressures based on a comparison with the pressure result from cylinder 1. In effect, we carry out an absolute compression test on all cylinders using cylinder 1 only.
This is ideal for vehicles such as the GT86 where spark plug removal and compression hose installation is a real mission!
The above capture now indicates all cylinder pressures combined with the Raw Data from the pressure transducer and battery voltage.
Now, I mentioned, “identify the offending cylinders” which is normally easy with the absolute compression test as the software always assumes a firing order of 1342 for a 4 cylinder engine and knows the pressure transducer is installed into Cylinder 1 (as in this case).
The cylinders are then displayed numerically, so Cylinder 1 in the display is Cylinder 1 and Cylinder 2 is Cylinder 2 etc. This, however, does not apply with the GT86 whose firing order is 1324!
I will save you the calculations and confirm the results above indicate Cylinder 1 good (ID1), Cylinder 4 (ID2) bad, Cylinder 3 (ID3) good and Cylinder 2 (ID4) bad
A New Feature Request has been logged here at Pico to provide technicians with the facility to enter varying firing orders and specify the location of the pressure transducer as cylinder 1 is not always accessible. Look out for this new feature in future software updates to PicoDiagnostics.
At this point in the diagnosis, we normally refer to the vehicle manufacturer’s technical data for known issues, bulletins or software updates. Given the history of the vehicle, this was not pursued.
To recap, there are a number of points we have to consider.
The vehicle cranks and fires occasionally accompanied with an odd intake and exhaust note.
The customer says that all compressions have been checked and are above minimum specification
PicoDiagnostics indicates that two compressions are very low
Cranking speed is normal
Based on the initial evaluation, experience, accessibility and more so in this case; historical repairs, I had to suspect valve timing. But how could there be 4 good compressions (alleged by the customer) with incorrect valve timing?
I do hate repeating tests but I felt compelled to carry out 4 individual compression tests with PicoScope in conjunction with the pressure transducer. This would verify both the test results from PicoDiagnostics and the customer’s compression results, and hopefully reveal any anomalies in the four-stroke cycle (three birds, one stone).
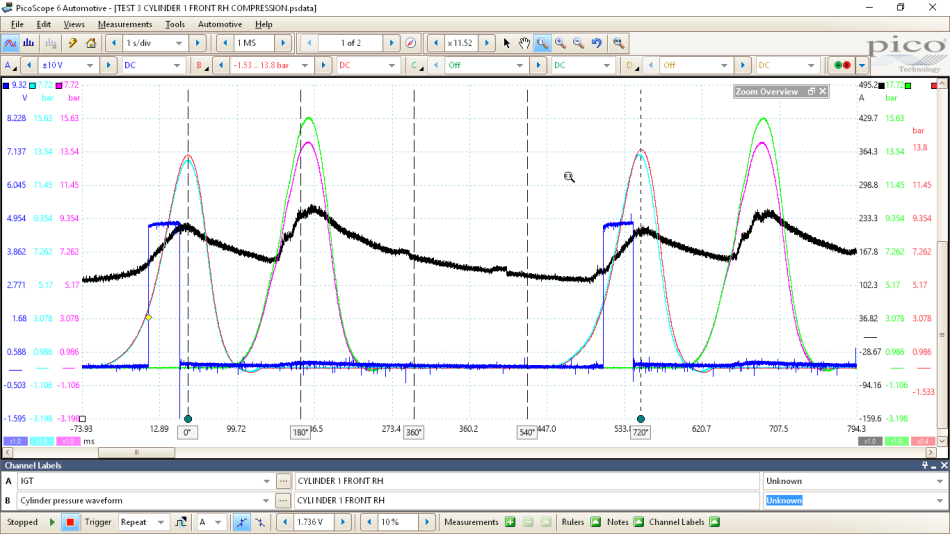
I chose to carry out 4 compression tests, all synchronized to the ignition trigger event of Cylinder 1 (IGT 1) with fueling prohibited. To my amazement, the customer was correct and PicoDiagnostics was wrong. Or were they both right? All cylinders measured between 13 and 15.5 bar (188 to 224 psi).
Call it instinct but I knew something was most certainly wrong with the compression events of this engine and so I used a current clamp to monitor the starter motor current (synced to IGT 1) during cranking, in an attempt to further qualify the compression results above.
Analyzing all the waveforms individually did not immediately reveal any concerns. So I looked at all the captured waveform together on the same screen with the Reference Waveform feature in PicoScope Automotive.
The Reference Waveform feature allows you to duplicate any waveform on screen and store a copy in your Reference Waveform library. You can recall these copies into any capture. A compression test is one such example where you duplicate the pressure waveform from each cylinder, store a copy in your library and recall them all together on a single screen for comparison.
To learn how to create a Reference Waveform you can read page 85 of the user guide here or you can use the Help menu in PicoScope Automotive.
The waveform above has the ignition trigger signal for Cylinder 1 (IGT1) on Channel A (blue) accompanied with Cylinder 1 compression on Channel B (red). In addition, we also have four Reference Waveforms, Black – Cranking Current, Cyan – Cylinder 2, Lime – Cylinder 3 and Magenta – Cylinder 4, all referenced to IGT 1.
By using the rotation rulers and partitions, something stood out immediately. Four compression events taking place in 360 degrees of crankshaft rotation instead of 720 degrees! The black waveform indicates the current draw of the starter motor during cranking (synced to IGT 1). It displays only two current peaks which is why the test in PicoDiagnostics indicated two low cylinders. This proofs that both the customer and PicoDiagnostics were right.
The use of rotation rulers and partitions provides you with invaluable information with regards to crankshaft position in relation to the four-stroke cycle. You can read more about these features on page 24 of the user guide here or by using the Help menu in PicoScope Automotive.
You may have noticed the minimal expansion pocket and the absence of an intake pocket with the cylinder pressure waveform. This is due to the low engine speed (cranking) with the throttle held wide open during the compression tests. Here then we have an atmospheric pressure within the intake manifold resulting in no intake pocket (no negative pressure).
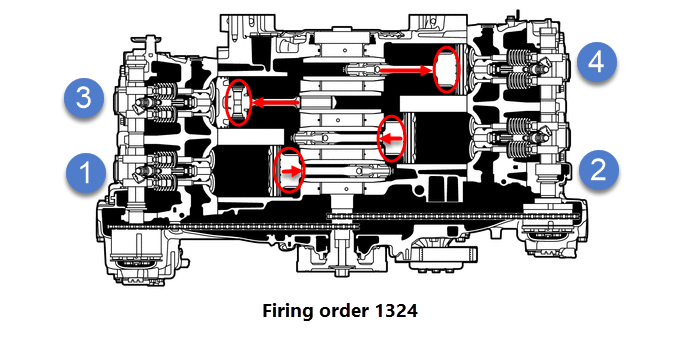
From this test, we can conclude that opposite pistons are compressing the air in the cylinder simultaneously. To understand the layout of the Subaru (GT86) flat-four engine, Figure 7 indicates the cylinder configuration and piston arrangement
When Cylinders 1 and 2 are at BDC, Cylinders 3 and 4 are at TDC.
When Cylinder 1 is at TDC on the compression stroke, Cylinder 2 should be on TDC of the exhaust stroke. This is not the case with our engine, as Cylinders 1 and 2 both compress at the same time (as do Cylinders 3 and 4).
Given that the engine had been reassembled following a major overhaul, the focus shifted to camshaft and crankshaft correlation. The good news here is that all four camshafts incorporate a camshaft position sensor.
Here I connected Channel A on PicoScope to our crankshaft sensor, Channels B and C to either the exhaust or intake camshafts, while synchronizing to Cylinder 2 ignition event (IGT 2) on Channel D
This form of non-intrusive valve timing check is ideal where a physical valve timing inspection can take many hours and include replacement of numerous parts. For a test like this, it is essential to have a known good vehicle to use for comparison.
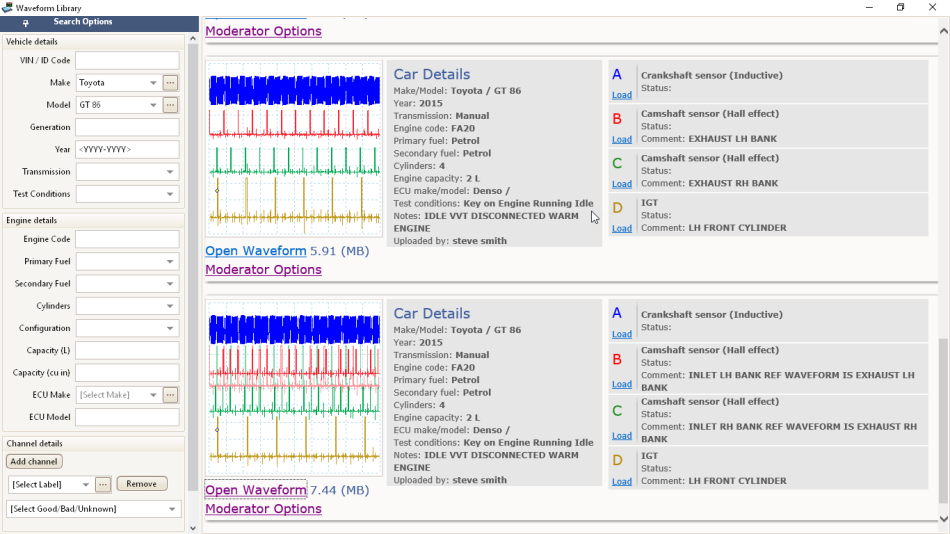
At the time of this test, the Waveform Library in PicoScope did not contain a GT86 example of camshaft/crankshaft correlation, so I had to source a donor vehicle. I uploaded the results from the donor vehicle for everyone to see in the Waveform library. Remember, to access the Waveform Library you need to have an Automotive PicoScope connected and a username and password for the Pico Auto Forum.
When you evaluate camshaft and crankshaft correlation on engines incorporating variable valve timing (VVT) it is essential to disconnect the relevant VVT controllers in order to restore the camshafts to their base position, in this case; fully retarded.
Below we have the example waveform from our donor vehicle using the Reference Waveform feature of PicoScope Automotive to allow multiple camshafts to be displayed on one screen (all referenced to IGT 2)
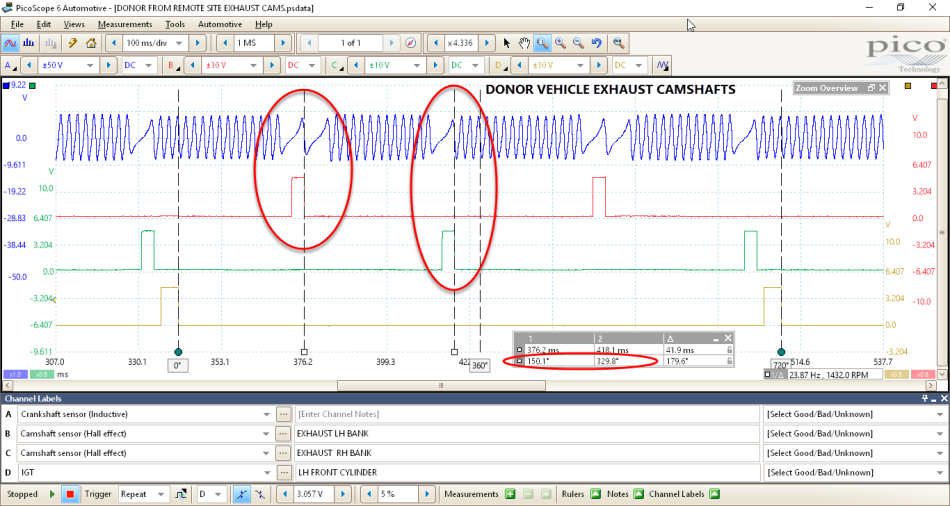
The first step was to compare the camshaft and crankshaft correlation between the known good donor vehicle and the customer’s vehicle. The waveform below shows the exhaust camshafts.
This is one of those “spot the difference” exercises.
If you look at the position of the exhaust camshaft pulses in relation to the missing teeth of the crankshaft they are not too far apart. By using the rotation rulers against the IGT 2 signal on channel D, I can approximate 720 degrees of crankshaft rotation. By introducing the time rulers, I can now measure the position of the camshaft pulses referenced to the crankshaft position. The numerical value of the ruler legend (highlighted in yellow), in degrees of crankshaft rotation, reveal the chosen camshaft pulses.
Donor vehicle:
Customer vehicle:
When we do have a timing discrepancy we must be aware that our chosen synchronization signal was IGT 2 which is varied by the PCM depending on a number of sensor inputs. The donor vehicle was also running at idle (VVT disconnected) while the customer vehicle was cranking with four compressions occurring in 360 degrees of crankshaft rotation. With this in mind, I felt as though I was in the ballpark with the exhaust camshafts, so it was time to compare the intake camshafts
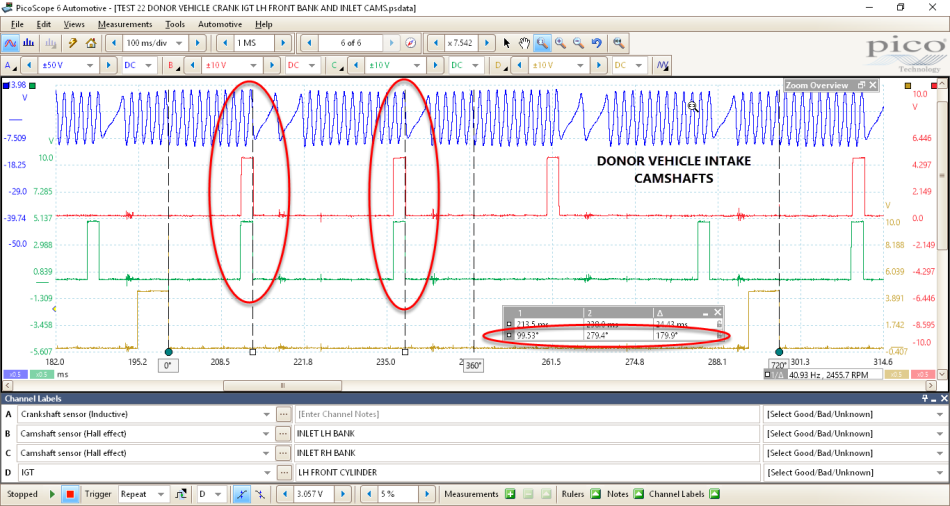
Below are the waveforms of the intake camshafts:
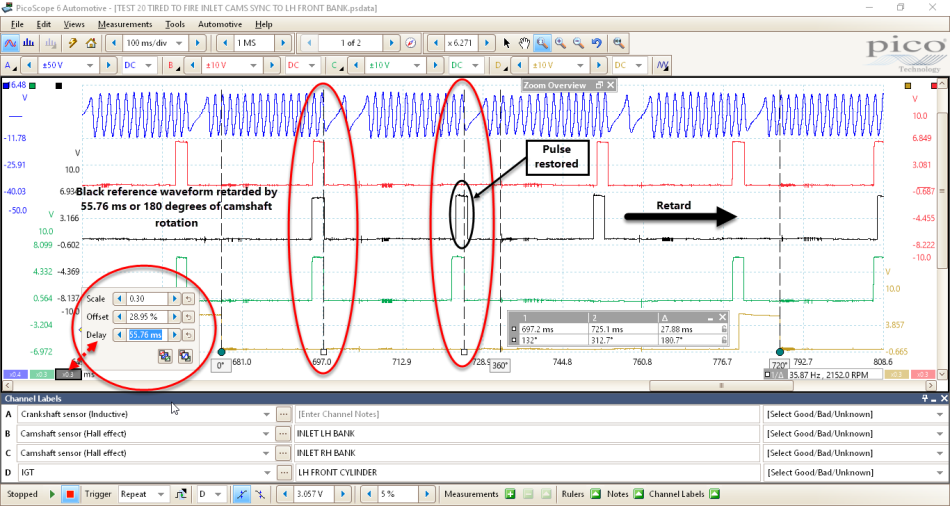
I think it is safe to say that we have discovered something here with the customer’s LH intake camshaft as it appears to be missing a pulse when compared to the donor vehicle. It is interesting that the pulses I have chosen to mark with the time rulers occur after 180 degrees of crankshaft rotation. You can see this in the ruler legend where the Delta or difference between time ruler 1 and 2 are indicated in both time (ms) and rotation (degrees).
Now for some math:
In the waveform Customer Vehicle Intake Camshafts, time ruler 1 is aligned with the falling edge of both the intake camshaft pulses at the start of the double missing pulses from the crankshaft sensor. The ruler legend indicates that this is 697 ms into the capture and 132 degrees of crankshaft rotation after our chosen zero degrees rotation ruler.
Time ruler 2 is aligned with the falling edge of the RH intake camshaft pulse (Channel C) at the start of the single missing pulse from the crankshaft. A similar pulse is missing from the LH intake camshaft. The ruler legend indicates that this is 725 ms into the capture and 312 degrees of crankshaft rotation after our chosen zero degrees rotation ruler.
The Delta or difference between time ruler 1 and 2 (also displayed in the ruler legend), is 27.88 ms/180 degrees, which is no coincidence.
If you look at Channel B in the waveform (LH bank intake camshaft), moving the waveform to the right of the screen (retard) would make both Channels B and C come into line equal to the waveform from the donor vehicle. By creating a reference waveform of Channel B you can use the delay feature under the Axis and Scaling Control, to move the waveform left or right on the original capture.
Here is the math: If the ruler legend Delta value indicates 27.88 ms equals to 180 degrees of crankshaft rotation, this must also represent 90 degrees of camshaft rotation as the camshaft is driven at half engine speed. In order to retard the LH bank intake camshaft waveform by 180 degrees, you have to double 27.88 ms to 55.76 ms, which would equate to either 360 degrees of crankshaft rotation or 180 degrees of camshaft rotation (illustrated in the waveform below).
This shows how the black reference waveform (which is a duplicate of Channel B LH bank inlet camshaft) has been retarded by 180 degrees (camshaft rotation) and does now align correctly when it is compared to the waveform of the intake camshafts from the donor vehicle.
My conclusion at this stage was that the LH intake camshaft was advanced by 180 degrees (camshaft rotation) and the LH exhaust camshaft is marginally advanced. But if this was the case, how was it possible to obtain four good compressions?
Based on the diagnosis above I had enough evidence to warrant a removal of the engine and timing cover to physically inspect the valve timing. This was a big decision to make as the engine had been removed just before, but a thorough and documented diagnostic process cannot be wrong. Or can it?
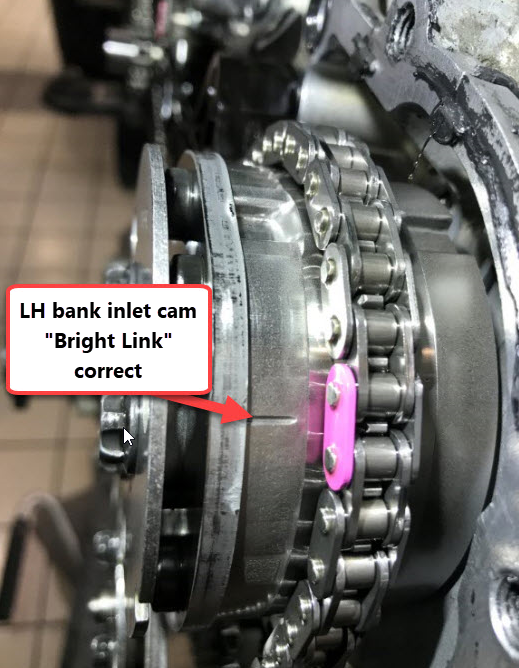
After removing the engine and timing cover, I referred to the workshop manual to confirm the valve timing. I started with the LH bank, to my horror the LH intake and exhaust camshafts were correctly timed according to the position of the “Bright Links” incorporated into the timing chain. How was this possible?
So I moved on to the RH bank timing chain.
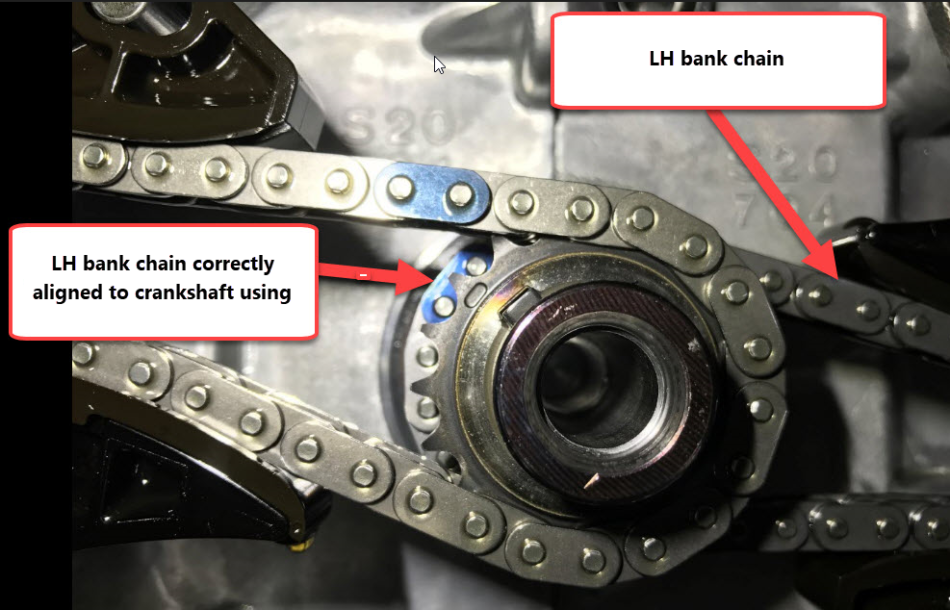
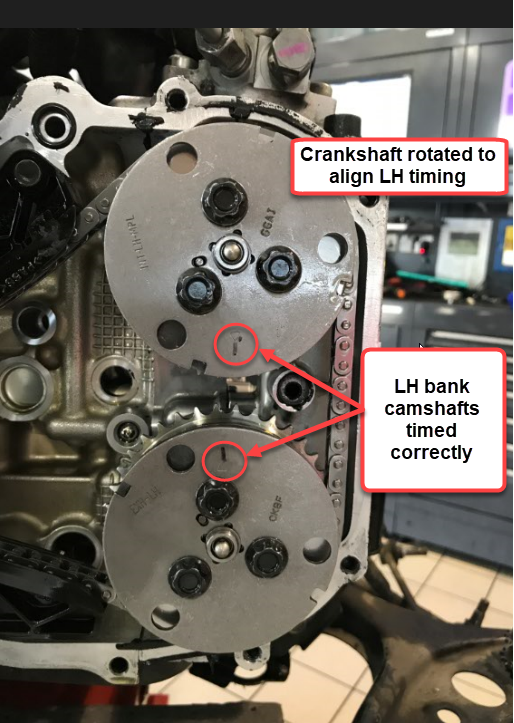
With the LH bank chain set correctly using bright links, the crankshaft is required to be rotated until the LH bank camshaft timing gears are aligned as below (this is quite a lot of rotation).
If the engine is timed correctly the RH bank camshafts should replicate the LH bank camshafts timing marks, whereby they should face one another, to my amazement, the RH bank camshafts were 180 degrees advanced!
So how was this possible when our waveform captures indicated a 180-degree advanced camshaft timing error for the LH bank inlet cam and a marginal error to the LH bank exhaust camshaft when compared to our donor vehicle? The clue is the 180-degree camshaft timing error!
While the RH bank camshaft timing was 180 degrees advanced, if the crankshaft was rotated 360 degrees the camshafts would be correctly timed on the RH bank. This, in turn, advances the camshafts on the LH bank by 180 degrees. The PCM is waiting for cylinder 1 (RH front) valve timing to align before commencing the ignition sequence 1324. I mention this because the IGT 1 signal was correct for cylinder 1 (RH bank front cylinder).
The fact that our valve timing was 180 degrees advanced presented a unique challenge when comparing camshaft signals (especially regarding the exhaust camshaft).
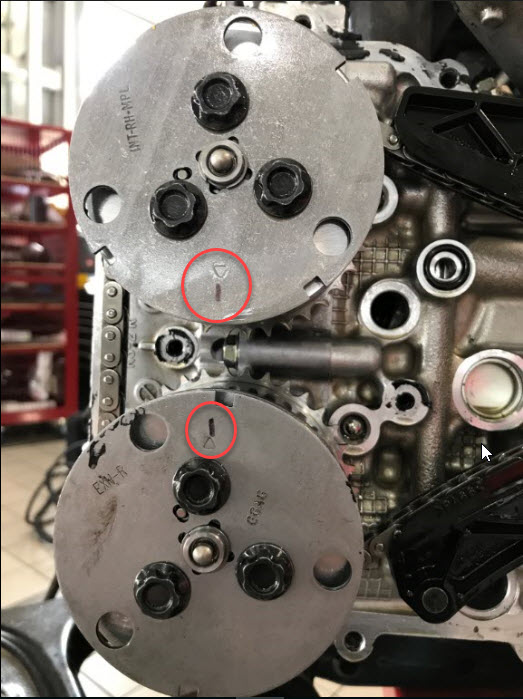
As you can see below, the ID markers on the exhaust camshaft are set at 180-degree intervals. Therefore, a 180-degree timing error with the exhaust camshaft cannot be identified as their ID markers are 180 degrees apart. Luckily the intake camshaft positions can be identified as erroneous based on 3 ID markers being 90 degrees apart.

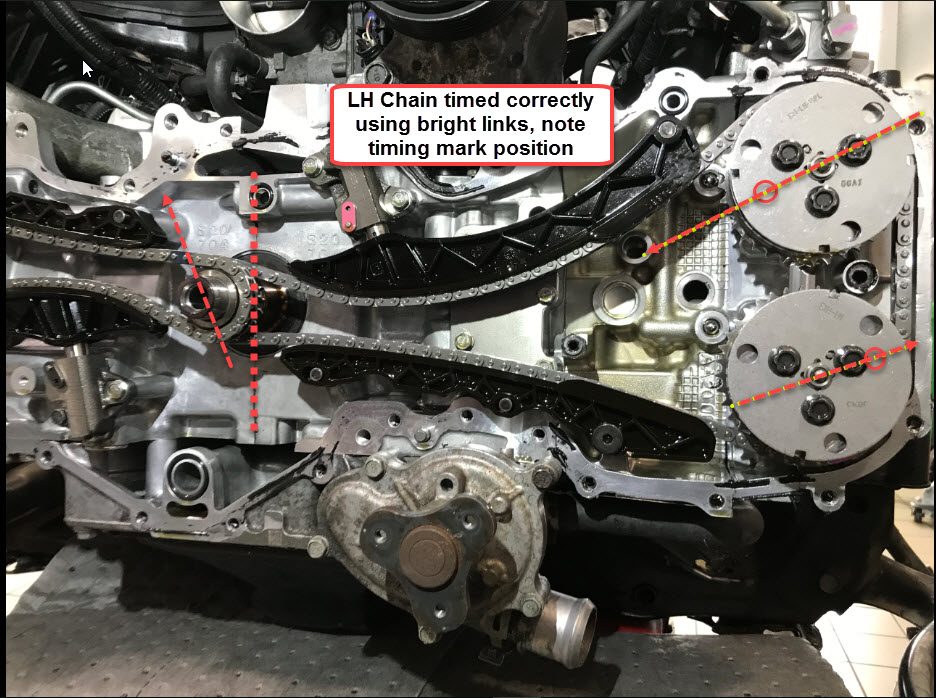
I reset the valve timing for the RH camshafts as described in the workshop manual and reassembled the engine. (See engine timing configuration after correction in the images below.)
While I was unable to witness the grand start-up of this engine, I received a phone call from a very relieved customer to say all is well and thank you.
On this occasion, only gaskets and consumables were required to correct the valve timing
Looking back over this case study, I wonder if I could have tackled this differently in order to speed up the diagnostic process. (I guess hindsight is a wonderful thing)
Lakis
March 31 2020
That was a very advanced case study
Thank you for sharing 😉
Miles Krase
August 14 2019
Had the same exact issue on a Forester with the same engine. Was apart for valve job/oil leak, ran fine before. Brought to us with odd sounding cranking rhythm/no start and would maybe sometimes start/sputter. Compression test mostly okay, no major leakdown. My testing also lead me to believe left bank out of time. They were hesitant to pull the motor down again, but gave us the okay. I about died when I found the bright links on the left bank were correct! That’s when I found this article. Right bank was 180 out. It really pays to pay very close attention to the installation instructions on these (and any other complicated timing system) motors. They were quite surprised to learn that the crank needs to be turned about 580 degrees before setting up the right bank, after left bank setup. Thank you much for this writeup!!!
Martin Rubenstein
May 31 2017
I can’t remember reading a diagnostic problem as interesting and as challenging as this one. Without a thorough grasp of the technicalities of the system and practical experience of using the PicoScope, I wonder how, or if, the problem would have been solved, and how many new parts would have been thrown at the engine in the hope it would fix it. Thanks, Steve; a great read.